All-Time Highs – Where to Next?


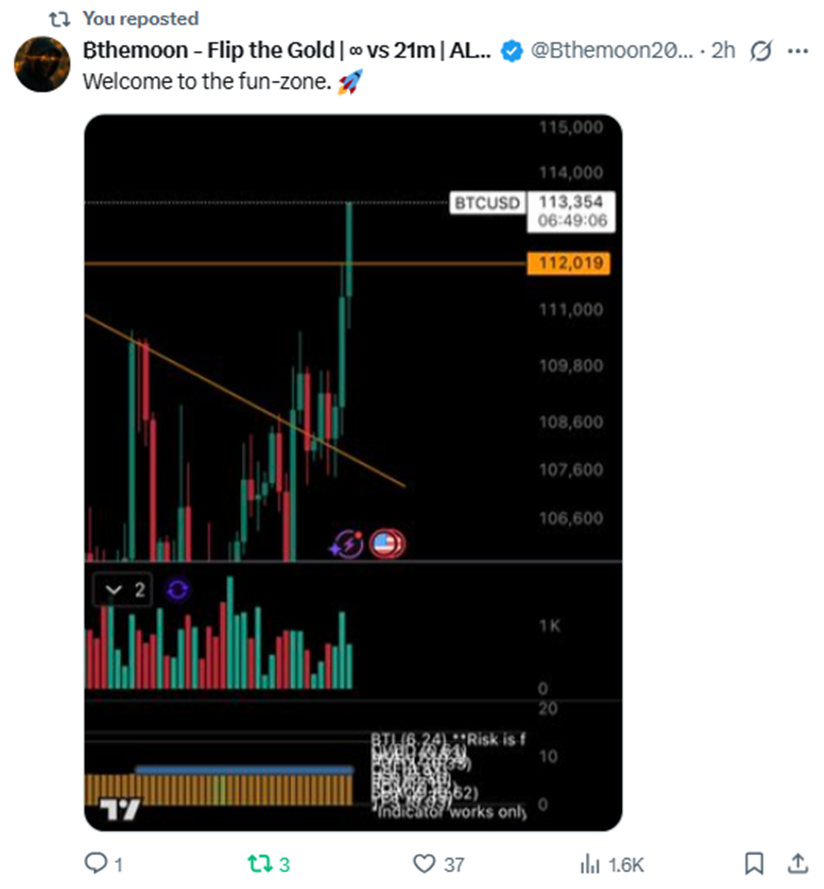
With Bitcoin smashing through its previous all-time highs, we’re entering what some call the fun zone. But where to next? Are we reaching our peak or just getting started?
In this issue, we zoom out to examine the broader macro trends shaping Bitcoin’s future—and provide the latest intel on the rise of Bitcoin Treasury Companies (BTC-TCs).
The Bitcoin Big Picture
As I type, Bitcoin is charging into uncharted territory.
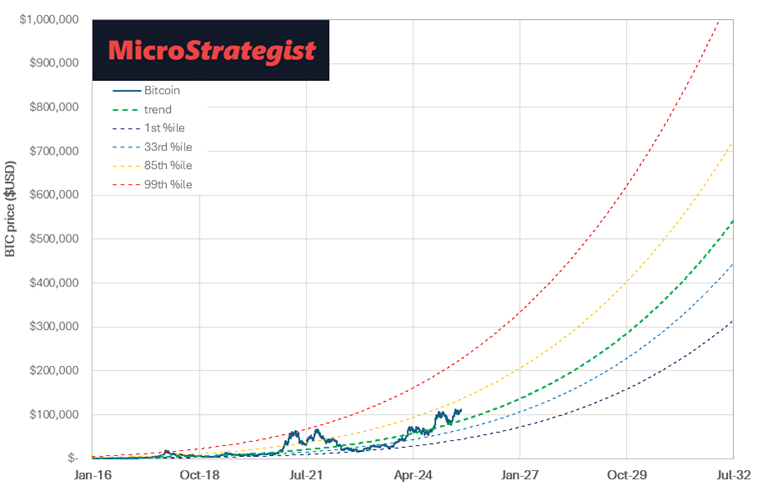
While it might feel like we’re getting overheated, zooming out reveals that BTC is still cruising along its power law channel. Currently, it sits at the 68th percentile—warm, but well below the 72nd percentile spike we observed after the US election.
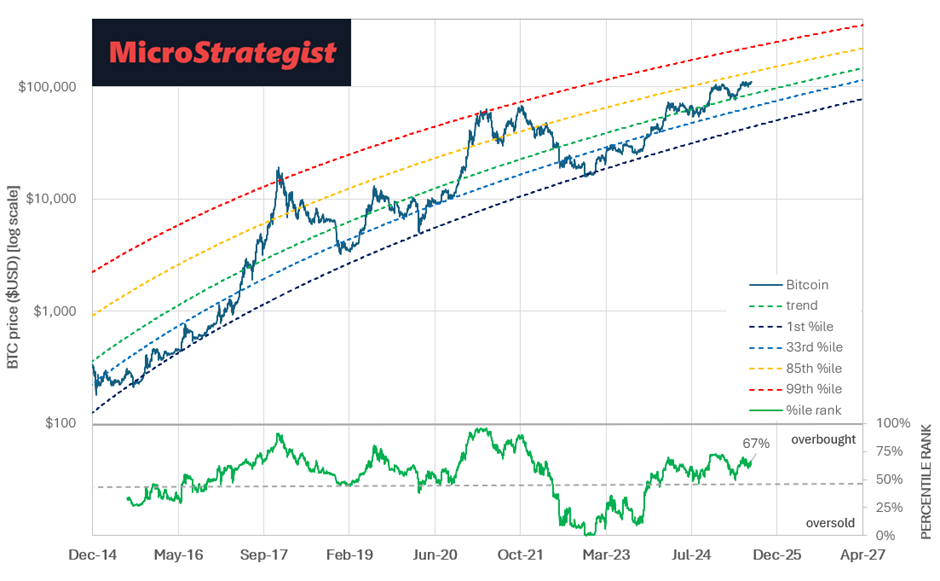
If history repeats itself and BTC peaks at the 99th percentile towards the end of this year, we could see a price of around $300k.
That said, this cycle is different. Retail FOMO and leverage seem absent, replaced by a more strategic and sustained accumulation of treasury companies. The result? Slower, steadier growth.
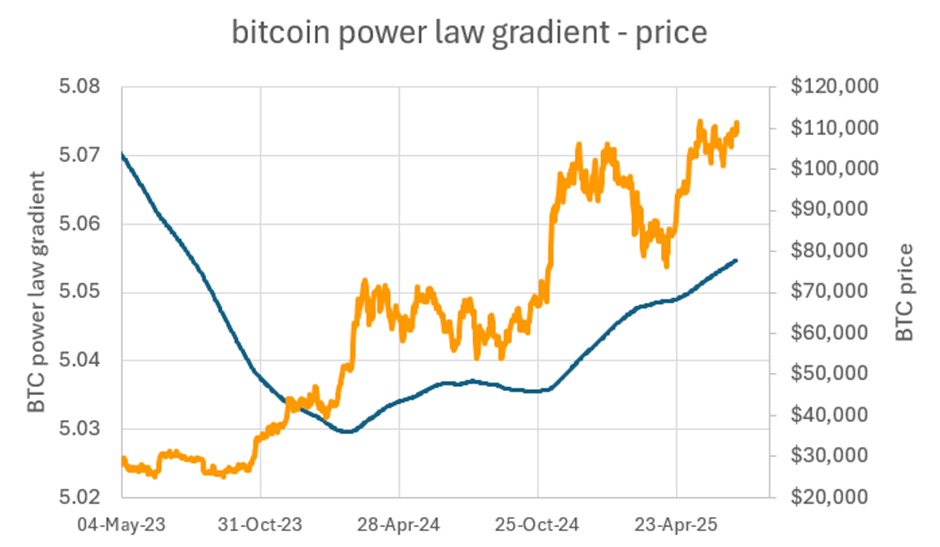
We’ve also observed that the gradient of the power law is increasing, reflecting the ETF-fueled influx of institutional capital. Remember: the power law isn’t static. It evolves as new data arrives, constantly recalibrating our expectations.
Some argue that the power law underestimates Bitcoin’s true potential. But take a step back and look at the linear (non-log) scale, and it’s clear: the future is still wildly bullish. Even in scenarios of monetary debasement or hyperinflation, the power law adapts, giving us a dynamic guide to both opportunity and risk.
Liquidity, Inflation & Election Cycles
Back in April, markets were spooked by DOGE’s proposed spending cuts and tariffs, but those fears seem to be fading. The more likely scenario? A return to rising government debt and more liquidity—rocket fuel for Bitcoin.
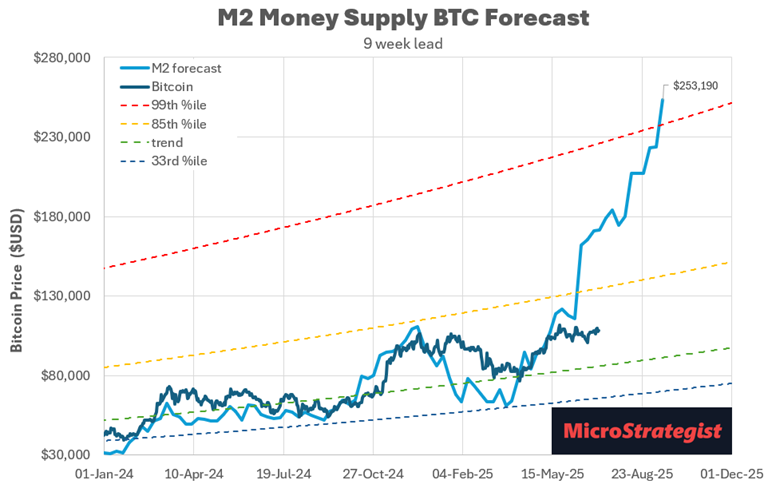
Historically, this phase of the US election cycle has been characterised by a surge in government spending, which injects liquidity into the system. While correlation isn’t causation, Bitcoin seems to track closely with M2 money supply, with a 9-week lag. If that trend holds, the outlook is undeniably bullish, with $250k BTC in the next three months.
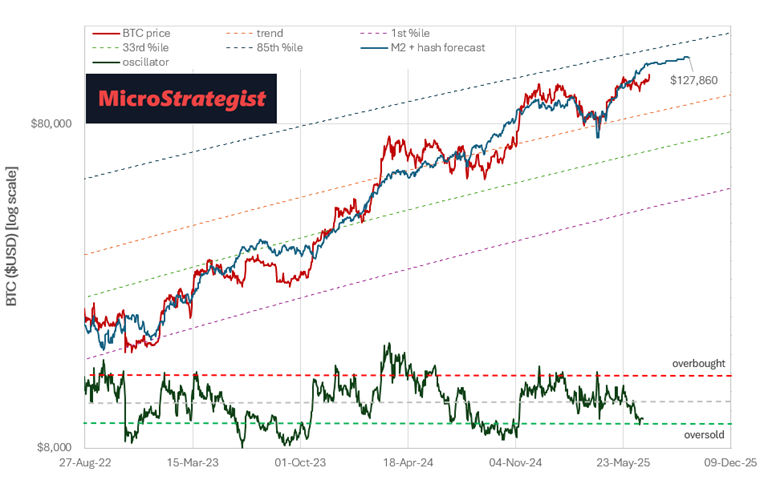
Beyond M2, our broader valuation model (based on hash rate, gold, the S&P 500, and M2) also suggests BTC has room to run. Not quite as bullish as the M2 alone—but still compelling. The oscillator on the chart is starting to resemble the oversold zone that developed before the US election surge.
Bitcoin Treasury Companies
Forget retail. This cycle belongs to Bitcoin Treasury Companies. With new players launching weekly, investors are seeking higher returns through BTC-TCs that offer yield without the risk of margin calls. However, just like the alcoins of previous cycles, BTC-TCs carry similar risks of pump and dump, with venture capital funding embryonic BTC-TCs to facilitate a profitable early exit.
Bubble Chart
Our popular BTC Yield vs. mNAV bubble chart reveals what the press releases don’t: who’s delivering. Currently, Vanadi Coffee, Day Day Cook, and Miliuz stand out as strong buys on a risk-reward basis.
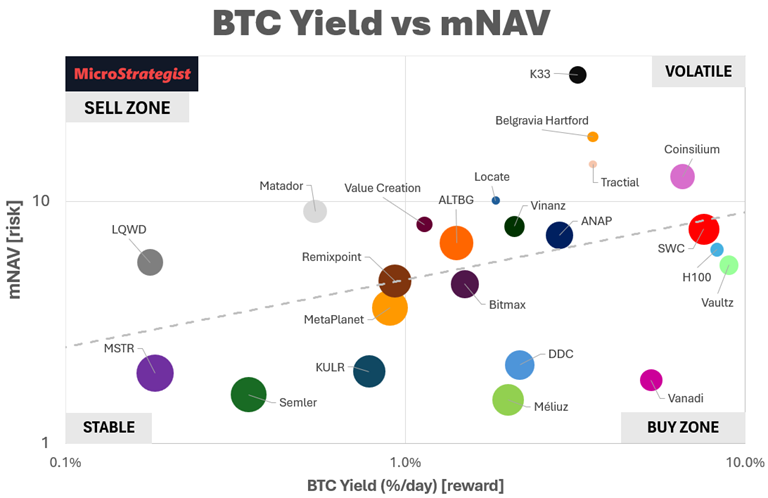
Every BTC-TC follows a lifecycle. Smaller companies can deliver eye-popping BTC Yields and command steep premiums. However, as they mature, stacking slows, volatility diminishes, and value aligns more closely with on-chain BTC holdings.
Days to Cover mNAV
Enter our favourite metric: Days to Cover mNAV—an estimate of how long it’ll take to "earn back" the premium at the current stacking rate. The lower, the better. Again, small caps like Vanadi, H100, SWC, and DDC lead the pack.
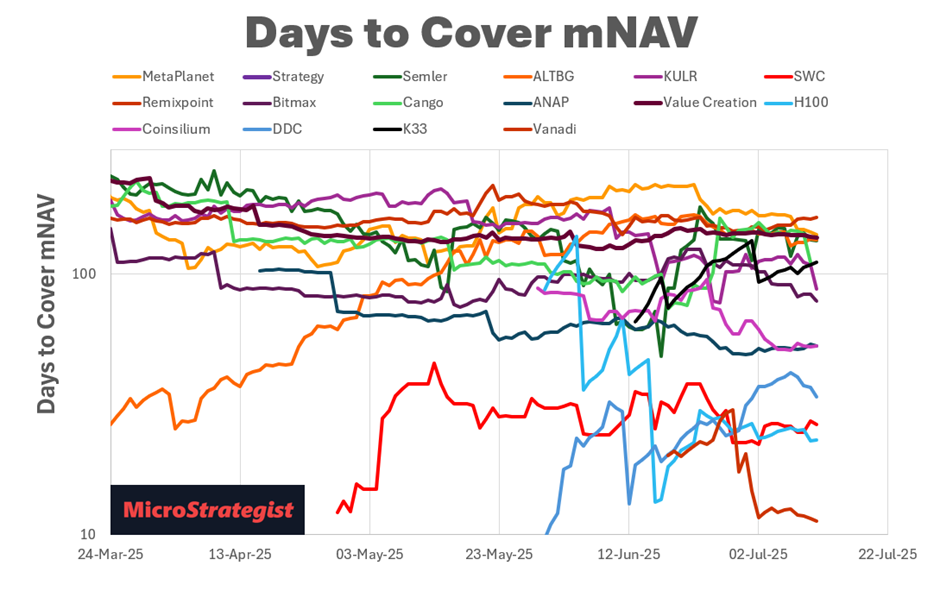
But beware: while these early-stage companies are exciting, they’re also fragile. If they stall, mNAV collapses. Savvy investors watch closely—or wait for proof of consistent delivery.
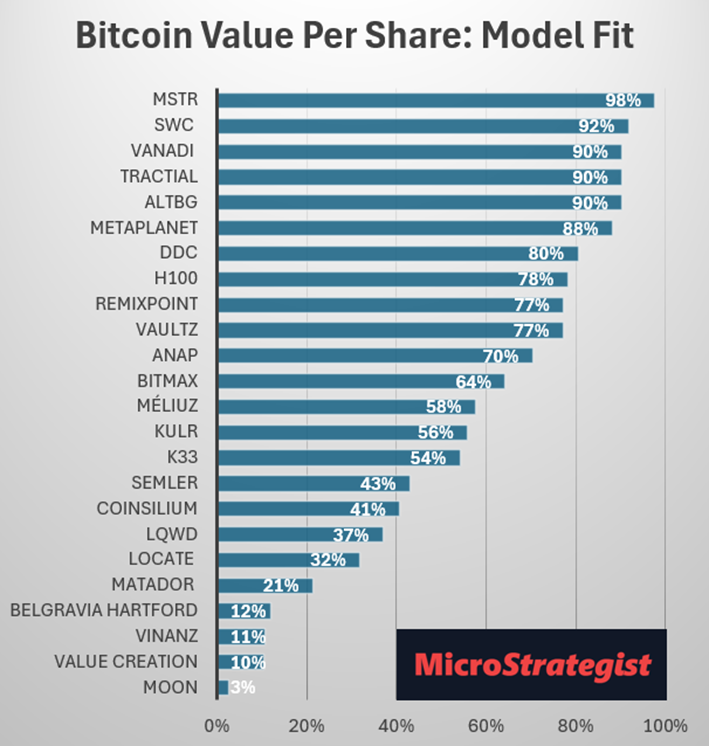
Model Fit Score
Our updated model fit score indicates which companies are tracking closest to their rising bitcoin value per share, suggesting that investors view it as a more pure bitcoin play. It’s a key factor in our optimised BTC-TC portfolio.
Companies toward the top of the chart are seen as pure bitcoin plays. Meanwhile, the companies toward the bottom of the chart may hold bitcoin on their balance sheet, but the market is valuing them based on the existing business model, not bitcoin.
Yields, Decay, and Long-Term Trajectories
BTC Yield follows a predictable power-law descent. As supply caps out at 21 million, yield must eventually slow, and mNAVs will adjust accordingly.
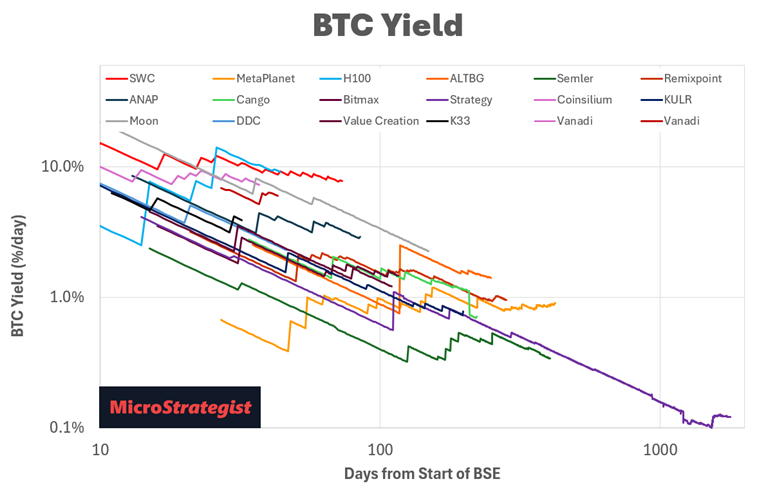
Shout out to MetaPlanet for maintaining a steady 0.9% daily BTC Yield. That kind of consistency gives them room to grow without exhausting momentum.
Meanwhile, companies that launch with flashy mNAVs often struggle to maintain them. Take Strategy, which temporarily juiced its yield with ATMs and convertibles last October, only to fall from a 4x mNAV to 1.9.
Maximum Bitcoin Stack: Logistic Regression
Our updated Stacking Race chart now includes logistic regressions to highlight when growth starts to decelerate. Most BTC-TCs start fast, but only a few can sustain it. Once the exponential fades, we get a glimpse of their long-term ceiling. If growth stalls too quickly, investors risk getting left holding the bag.
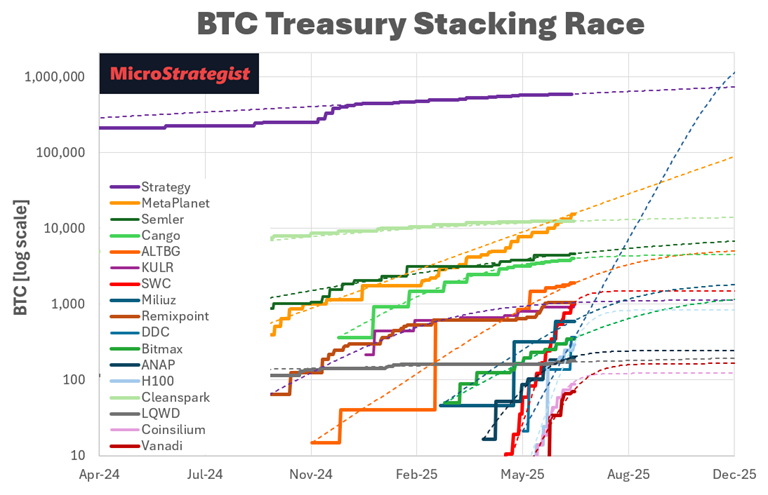
Logistic regression (i.e., s-curve) attempts to predict a company's maximum BTC stack as soon as it departs from unsustainable exponential growth. There are no absolutes, but this scenario provides a bearish outlook to cut through the hype and manage the downside risk of mNAV implosion that will occur when stacking decelerates.
What’s Coming Next?
Behind the scenes, we’ve been hard at work developing new models and dashboards to track this rapidly evolving space.
We’re finalising a major BTC-TC dashboard rollout and have plans for more in the months ahead. Long-term, we’re building towards full automation so subscribers can check real-time updates anytime.
It’s a challenge keeping pace—but also an incredible opportunity. This is the gold rush moment for Bitcoin treasuries. And those who know how to read the data—not the headlines—will be best positioned to win.