Bitcoin vs Gold: Some Christmas Hopium (With Data)


2025 was meant to be a big year for Bitcoin.
We had the Strategic Bitcoin Reserve narrative, expectations of a classic four-year-cycle peak, and no shortage of bullish catalysts in the pipeline. After grinding sideways around $58k for much of 2024, Bitcoin finally ripped around the US election.
We surpassed $100k and briefly peaked near $126k in October.
Yet here we are at the end of 2026:
• ~6% lower year‑to‑date,
• ~10% down year‑on‑year in USD terms, and
• And even worse when measured against gold (we’ll dive into that more later).
TL;DR
· Bitcoin is slightly below trend in USD terms
· Historically extreme undervaluation vs gold
· Gold leads defensive phases; Bitcoin leverages liquidity turns
· If history rhymes, this looks more like a setup than a top
Zooming Out: Bitcoin Is Still on Track
In USD terms, the long‑term power‑law model provides a useful perspective.
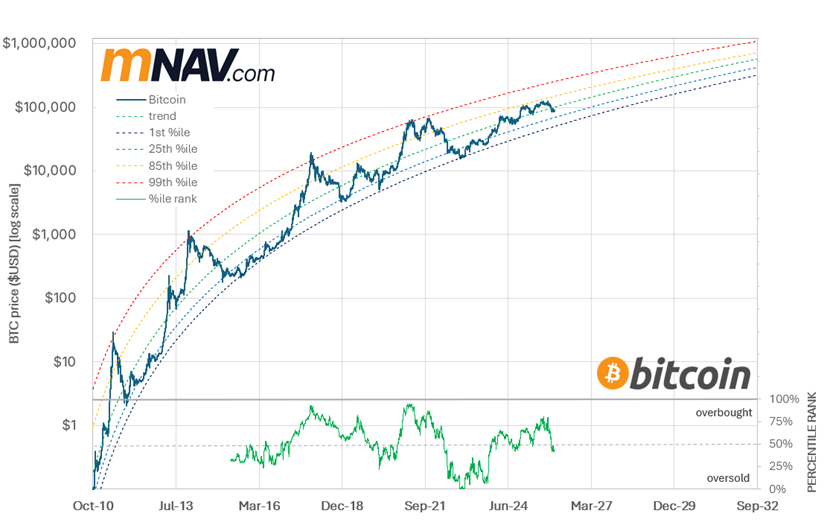
From $15k in November 2022 to ~$87k at the end of 2025, Bitcoin delivered a ~78% CAGR — an extraordinary run by any standard.
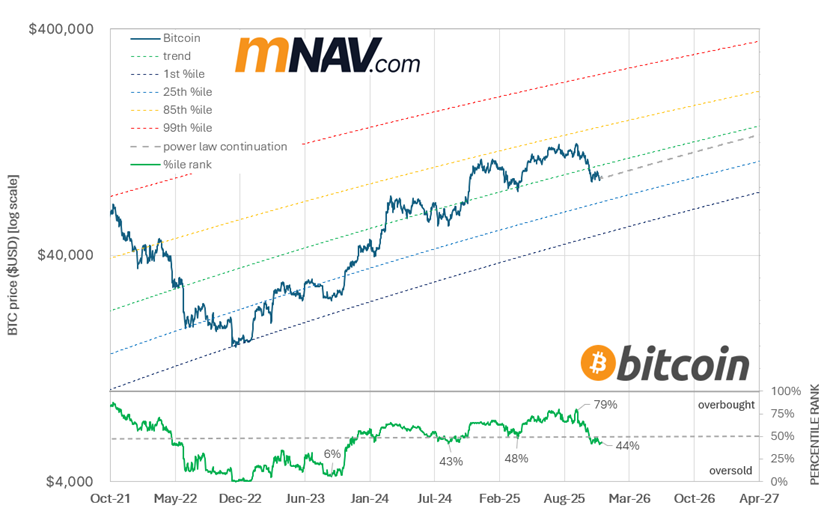
After running hot, it’s reasonable that Bitcoin is taking a breather. At present, it sits modestly below the optimised power‑law trend price of ~$100k, while the long‑term trend itself continues to compound at a very healthy 36% p.a.
If we take a glass-half-full perspective on Bitcoin, we could say we may have skipped the blow-off top everyone expected around now and just brought the bottom of the bear market forward by about a year.
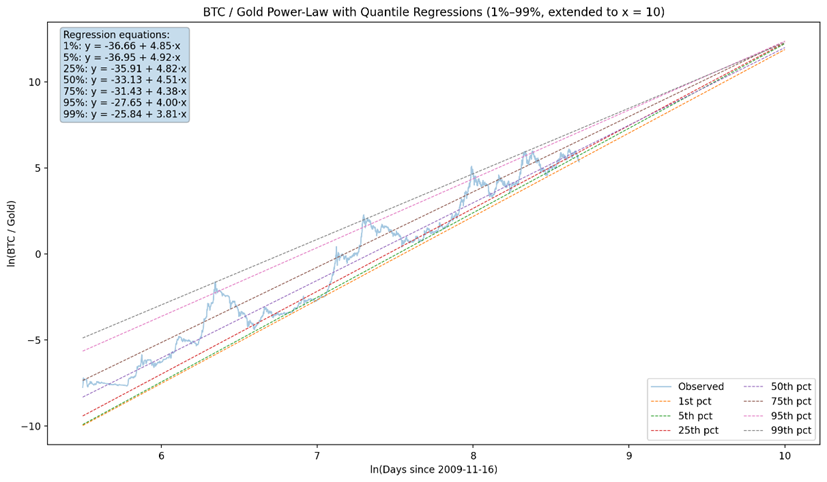
Bitcoin vs Gold: A Very Different Picture
However, when we compare Bitcoin to gold (rather than the U.S. dollar), we observe that Bitcoin is lagging, currently below the 1st percentile.
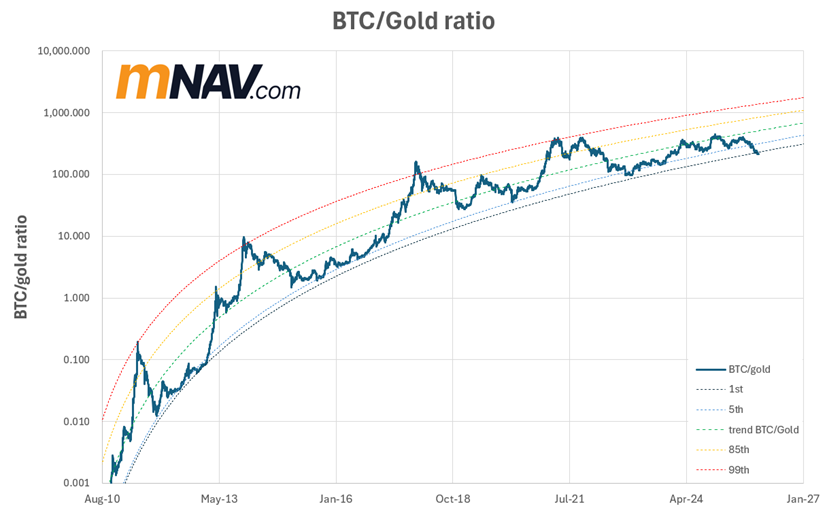
Similar to BTC/USD, BTC/gold also exhibits a power-law trend. When we optimise day 0 (16 November 2009), we get an R2 of 96%.
This divergence raises a simple but uncomfortable question.
Either Bitcoin Is Broken — Or It’s Loading the Spring
While it’s easy to get short-term FOMO, Bitcoin has been winning vs gold over the long term.
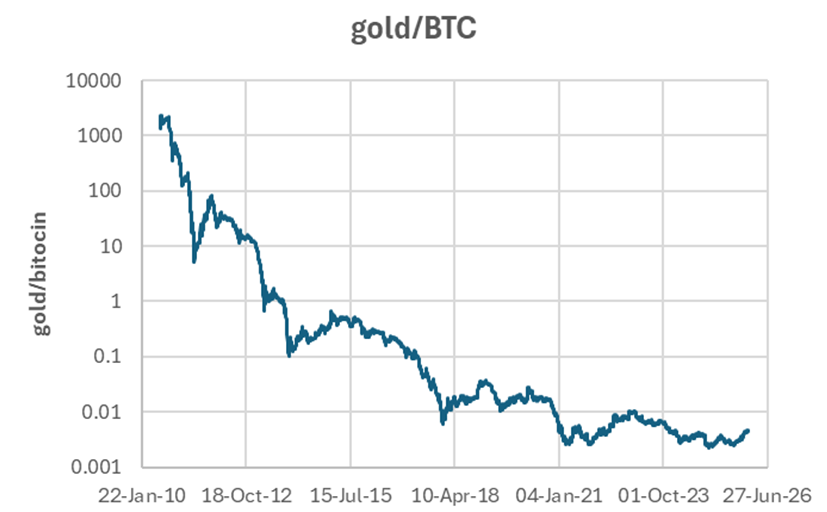
But, with gold ripping lately, Bitcoin hasn’t gone anywhere (in gold terms) for a couple of years. Either Bitcoin is structurally broken — or it has significant catching up to do once risk appetite returns.
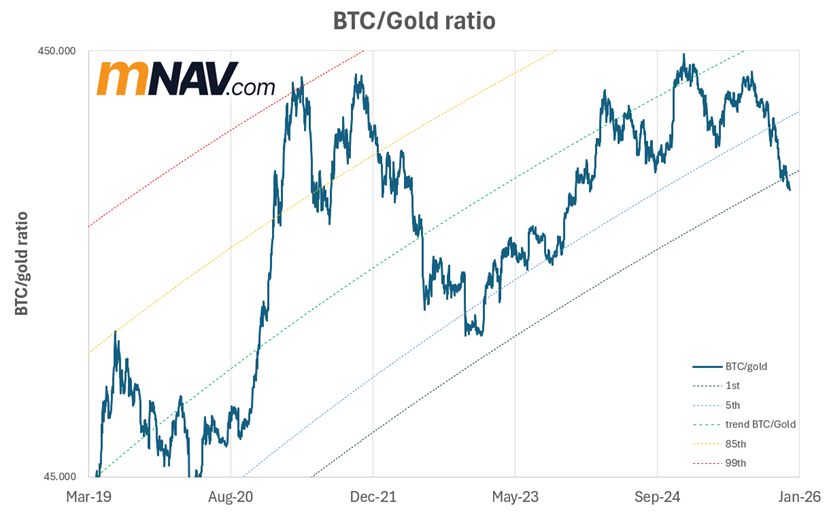
Where Bitcoin Sits on the Gold-Relative Spectrum
So, what does this mean for the Bitcoin price right now?
We can multiply the BTC/gold quantiles by the gold price to obtain the gold-inferred BTC price.
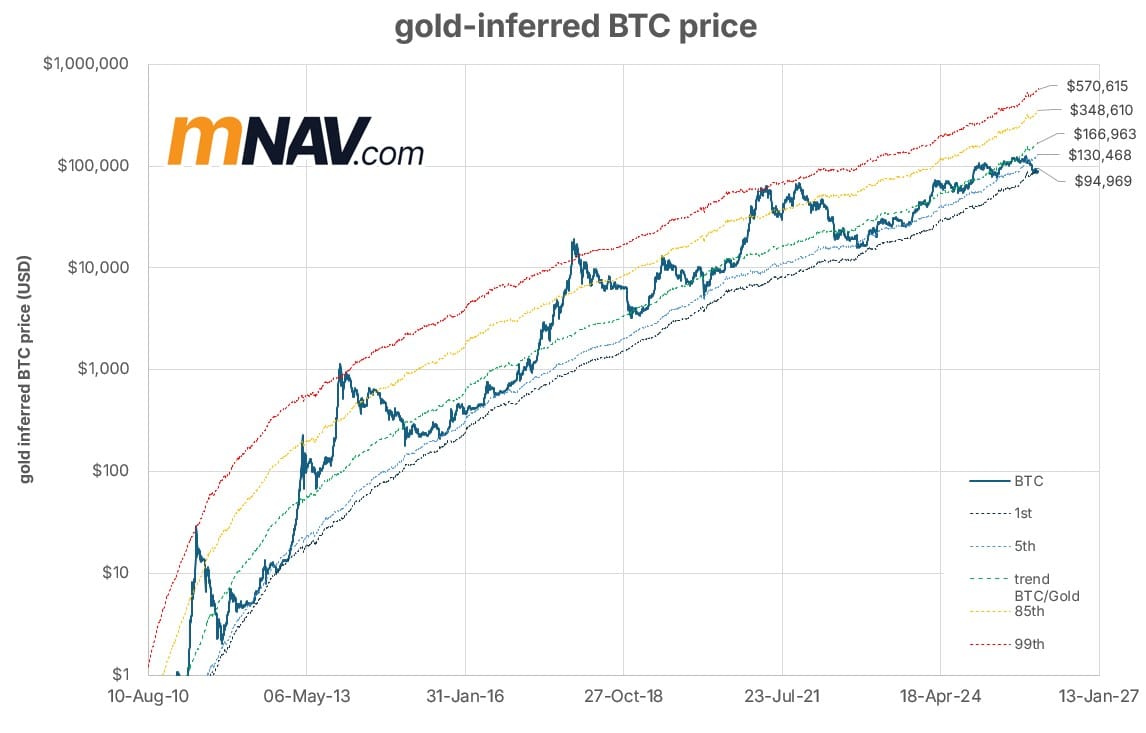
Right now, the power law trend for the gold inferred BTC price is $169k, while the:
· 1st percentile = $95k
· 5th percentile = $130k
· 25th percentile = $155k
· 75th percentile = $300k
· 85th percentile = $348k
· 99th percentile = $570k
When we denominate BTC in gold, Bitcoin has even further to run than when measured in fiat terms.
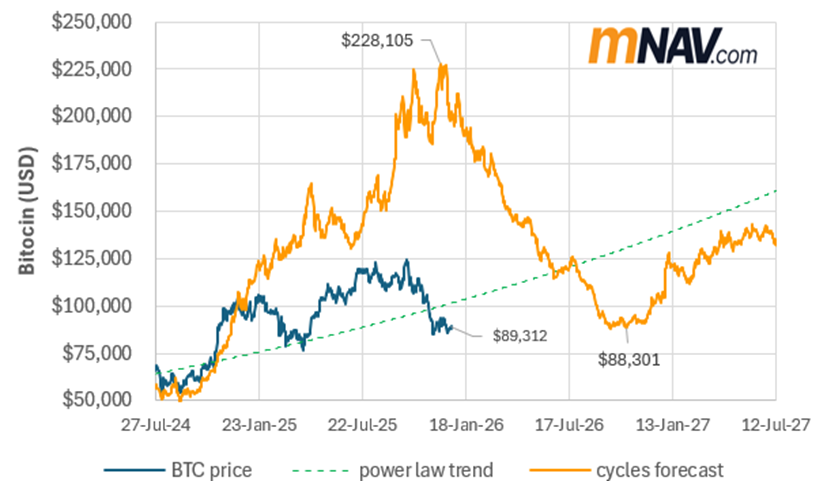
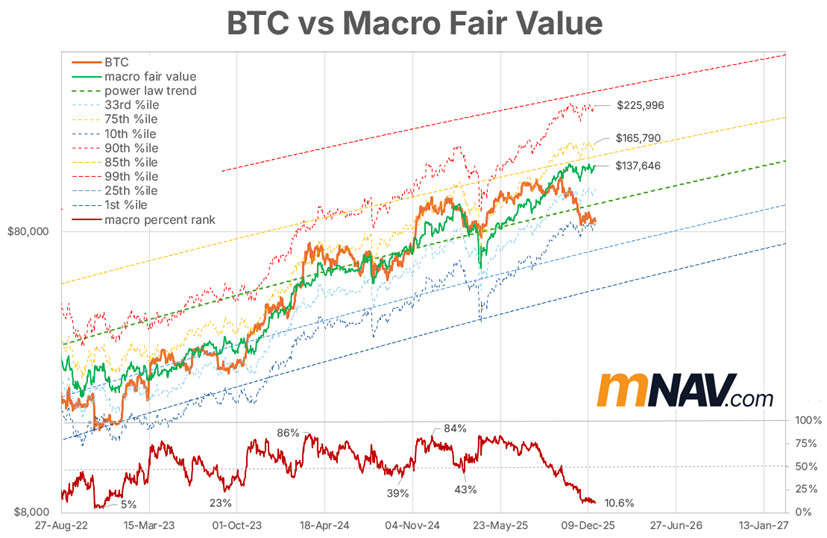
The future for Bitcoin is even brighter in gold terms than based on our macro fair value chart, which puts the fair value price of Bitcoin at $137k and the 99th percentile at $224k.
Why Bitcoin Is Lagging Gold (For Now)
There are a ton of theories right now about why Bitcoin is lagging gold, including:
· The massive liquidation event in October left the crypto market bruised and battered,
· Quantum FUD,
· OG whales taking profits into the traditional four-year cycle,
· Four-year cycle believers creating a self-fulfilling prophecy,
· Heavy options trades pinning BTC until 26 December 2025,
· A lagging manufacturing and economic cycle for the past three years,
· Long-term QT, which is only now slowly transitioning to gentle QE, and
· New legislation, like the Clarity Act, is taking its sweet time to be finalized.
While we’re all impatient, it’s impossible to know when these narratives will turn from fear to greed again.
But in the long run, Bitcoin maxis view BTC as digital gold, but better, with lower inflation, a hard cap, and portability.
Both gold and bitcoin, along with silver, which has also been ripping lately, are part of the debasement trade, that is, moving away from fiat to commodities that can’t be devalued by government money printing.
Central banks have been buying up gold to diversify away from the USD as part of a global trend in geopolitical risk hedging. Gold and silver are being bought by countries and institutions that cannot buy BTC.
Gold and silver are considered lower-risk assets than Bitcoin. Liquidity is still tight, and risk capital has crowded into AI, the Mag 7, and short-duration trades.
When Does Bitcoin Start Acting Like Digital Gold?
But Bitcoin is poised, ready for liquidity to flow back in. With QT ending, rates lowering, balance sheet expansion starting, and larger entities (banks and counties) adopting Bitcoin, BTC is poised for another big move.
When moon?
It’s impossible to tell.
Hyperinflation, hyper-bitcoinisation, and Lawrene Lepard’s Big Print seem to be taking their time.
In the words of Lynn Alden, it seems more likely that we’ll see a gradual print, with lower rates, as the US needs to roll its debt at lower rates in 2026.
Traditionally, gold typically breaks out first, liquidity stress becomes visible, policy shifts occur, and BTC catches up quickly.
Currently, we appear to be at the end of the tightening liquidity phase, ready for policy shifts that will support another run-up in BTC price from a low-risk entry point.
As risk appetite comes back, BTC can move much more quickly because it has a much smaller market cap ($1.8t vs $31t for gold).
Why This Looks More Like a Setup Than a Top
In summary, BTC is on track and a little below its long-term trend in USD terms. But in gold terms, it’s hard to see it going down much further from here, with a ton of upside when the market turns risk-on again.
With the recent pullback in Bitcoin, BTC-TCs, as leveraged Bitcoin proxies, have been doing it tough. Once Bitcoin rips again, we’re likely to see mNAVs expand, and hopefully the flywheel will start up again, with more tools in their arsenal, like preferred stocks to raise capital for more BTC buying.