BTC Treasuries, Power Law Projections & the Global Stacking Race Heats Up

Welcome to the third edition of MicroStrategist Weekly—your go-to source for cutting-edge insights on the Bitcoin treasury revolution.
As companies across the globe, from Tokyo to Surrey, race to stack BTC, we’re here to chart the winners, flag the risks, and spotlight the hidden gems driving this financial transformation as the BTC Treasury gold rush unfolds.
Bitcoin Holding Strong Above Trend: Safe Zone for Now
Bitcoin continues to cruise along above the power law trend line.
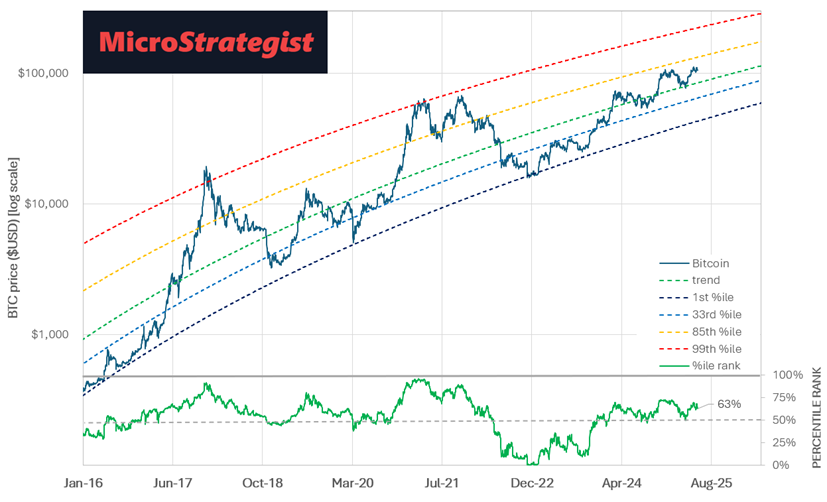
It’s currently getting a little warm, but far from overheated, at the 63rd percentile, which is currently in safe territory, well away from the upper power law quantiles of FOMO leverage that usually precede a rapid pullback.
Everyone wants to know what BTC will be worth in the future, so the table below shows the power law values, along with the 1st, 33rd, 85th, and 99th percentile quantiles, for the next ten years.
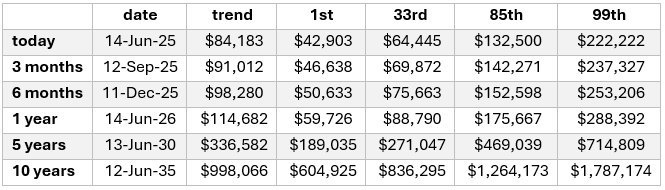
Macroeconomics, wars, and interest rate changes are hard to predict, but there’s a high probability that we’ll be somewhere between these guardrails in the future.
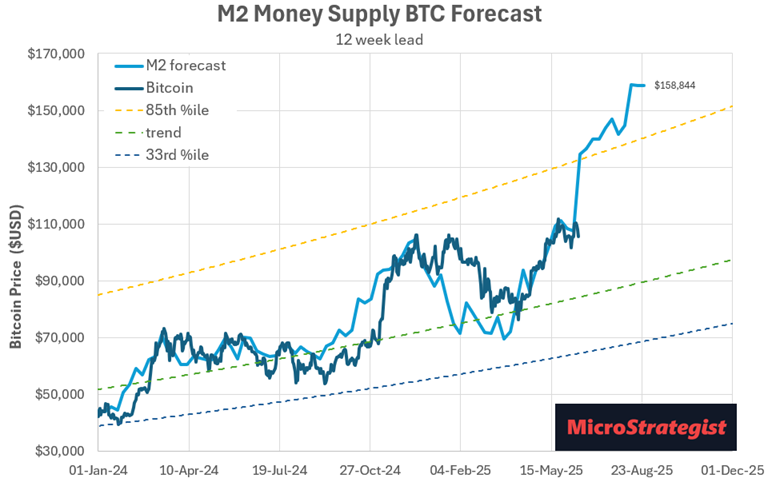
Global Liquidity Watch: M2 Suggests BTC Has Fuel Left
Bitcoin is a liquidity sponge, so keeping an eye on M2 enables us to understand whether the money supply is contracting or expanding, and hence where BTC may head next.
The growth in global M2 money supply has been taking a breather for the past few weeks, but assuming a 12-week lead, Bitcoin has a long way to go over the next few months.
Corporate Stacking: The BTC Treasury Race is On
The corporate BTC stacking race continues to accelerate with more companies joining in every week. As you’ll see, our comparison charts are starting to get pretty cluttered (sorry)!
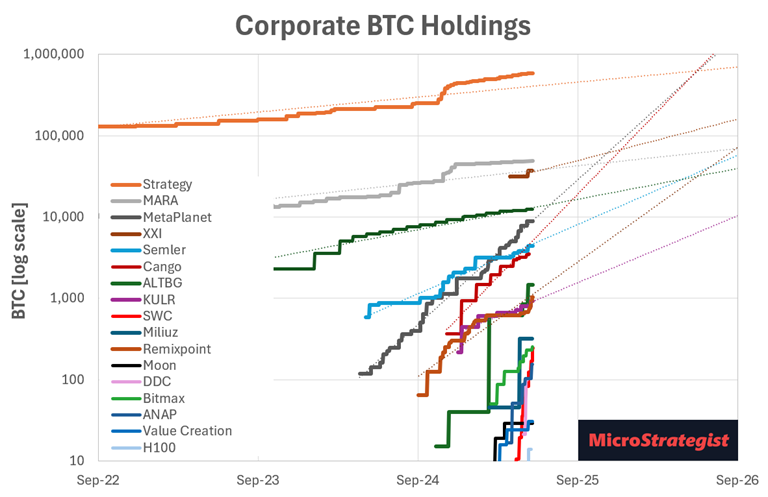
While many might think the smaller companies are less critical, they’re the ones that can grow their BTC stack the fastest. Continued BTC per share growth high (i.e. BTC Yield) is the most important thing to look for. Once the BTC stack grows, it becomes harder to find growing pools of capital to harvest and sustain funding for further growth.
Companies that can stay above the exponential trend line (linear on a log chart) are the ones that will become the new contenders, while those that fall below their exponential trend line will become the also-rans.
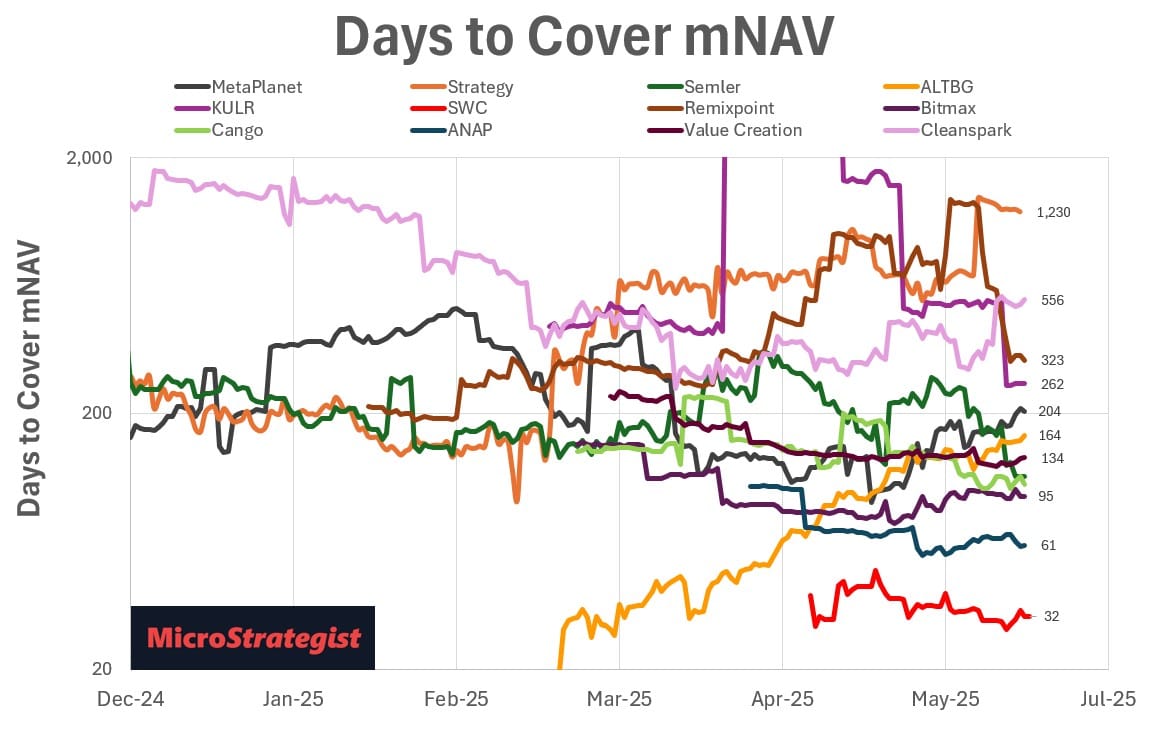
Stack Speed Rankings: DTC mNAV Update
The Days to Cover mNAV, first proposed by Adam Back, is proving to be the most critical metric in helping us understand where the share price is headed, often serving as a leading indicator of share price growth over the next few months. Companies with low DTC mNAV are earning their premium quickly.
Keep reading to see updated Days to Cover mNAV charts for all relevant stocks, as well as updated valuation charts for Strategy, MetaPlanet, Semler, The Blockchain Group and Smarter Web Company. We'll also introduce our new portfolio balancing strategy.
Our DTC mNAV chart is also becoming quite hectic after we added Cleanspark (CLSL), Value Creation (3238.T), ANAP Holdings (3189.T) and Cango (CANG).
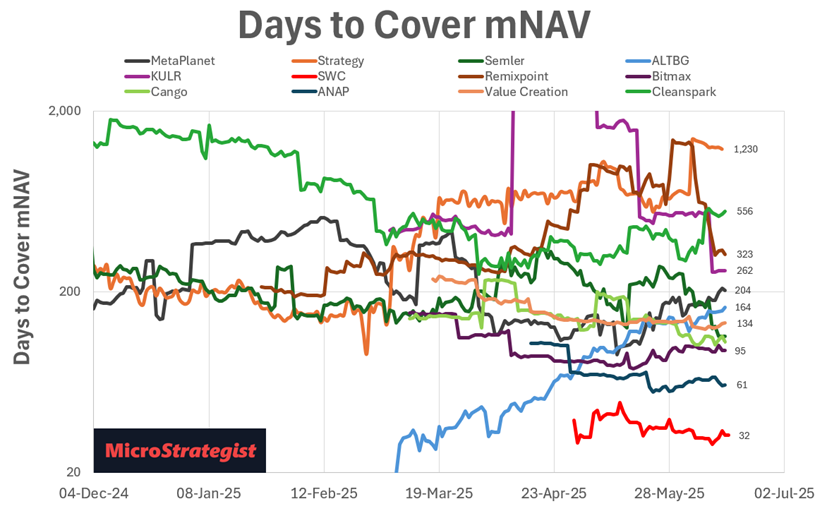
The Smarter Web Company (SWC.AQ) is still clearly in the lead with some super aggressive bitcoin stacking and a DTC mNAV of 32, but other companies like ANAP (3189.T) and Bitmax (377030.KQ) are not too far behind.
The fact that the companies stacking BTC the hardest are based outside the US (in the UK, Japan, and Korea) is a testament to the fact that the BTC stacking race is truly international. Sadly, countries, companies and individuals that do not start stacking aggressively now will be left behind.
Caution Zone: When High DTC Meets High mNAV
When it comes to fast-growing BTC treasury companies, it’s critical to understand that staying ahead relies on exponential growth in BTC/share, which is, by definition, ultimately unsustainable.
BTC companies with the highest mNAV have further to fall when momentum slows. So, as soon as you see DTC mNAV rising, mNAV contraction is likely on the horizon. So it’s a good time to be cautious.
The companies above he trend line in the chart below have benefited from a lot of positive sentiment recently, while those below the trend line are currently not getting the attention they deserve from the market (yet).
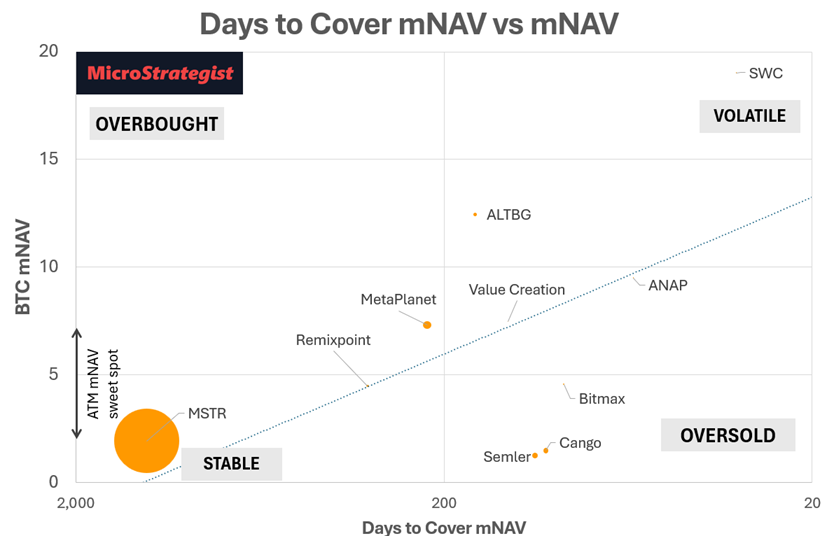
Companies in the top right are going to be volatile and move faster, while those towards the bottom left will be more stable, backed by a massive BTC stack. I’ve also shown an ATM mNAV sweet spot on the chart.
· Companies that fall below an mNAV of 2 or 3 struggle to sell shares at the market without excessively diluting their existing shareholders.
· Meanwhile, those with a much higher mNAV risk mNAV compression as traders harvest the profits before the company can leverage fiat from the equity market to stack more BTC.
What’s Undervalued? Fair Value Charts Reveal Buy Zones
While Days to Cover mNAV helps us understand which companies are stacking the fastest and earning their premium, the fair value charts help us know which ones are falling out of favour and may be a good buy relative to their long-term trend.
· Fair value is based on the long-term relationship between BTC value per share and its share price.
· The fair value percentile rank helps us understand where their current price is sitting relative to their typical range.
· We can then forecast future share price based on their current BTC Yield and a conservative 30% CAGR for BTC (per the power law).
MSTR: Oversold Gem or Cautionary Tale?
While MSTR has a relatively high DTC mNAV (1282 days) and is oversold, there is still considerable upside potential if their preferred shares continue to gain traction, enabling them to harvest fiat from the $300T bond market to continue increasing BTC/share.
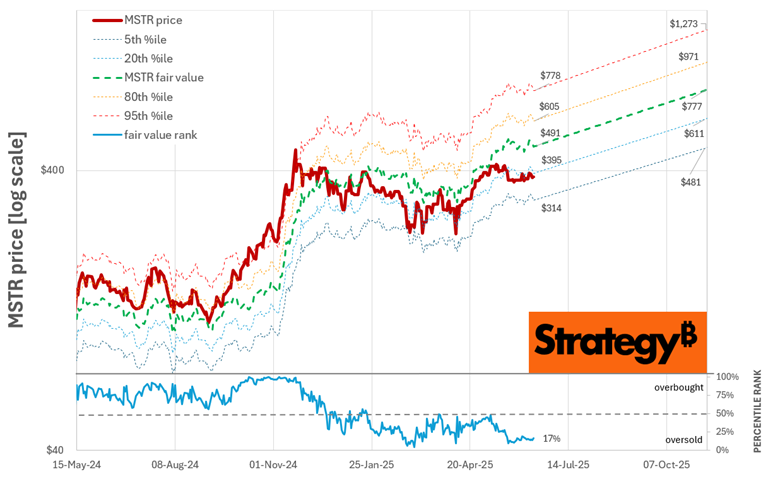
Strategy’s fair value (based on the relationship between BTC value per share and price) is currently at $491. With their current BTC Yield of 0.18% per day and power law growth, MSTR’s fair value in three months sits at $777, which would be a CAGR of 358% p.a. from here. If this traction continues, MSTR may regain favour, especially if Strategy secures S&P inclusion. But only time will tell.
Too Hot to Handle? MetaPlanet Hits the 95th Percentile
Similar to MSTR back in October (before it peaked with an mNAV of 4), MetaPlanet is the hot new BTC Treasury that everyone is talking about, currently running at an mNAV of 6.8.
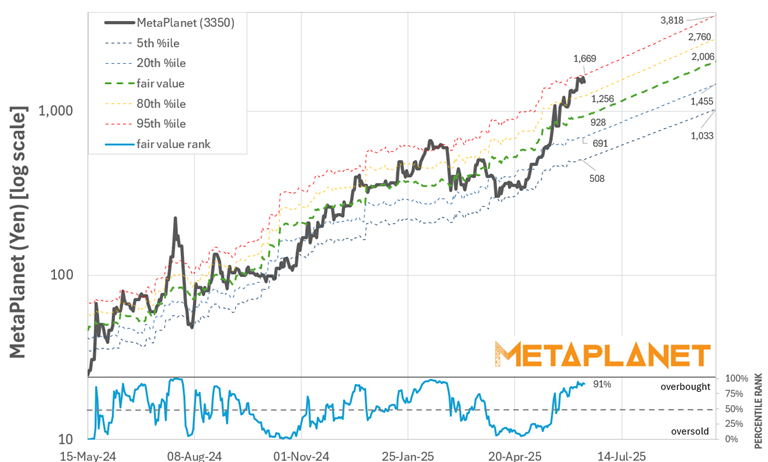
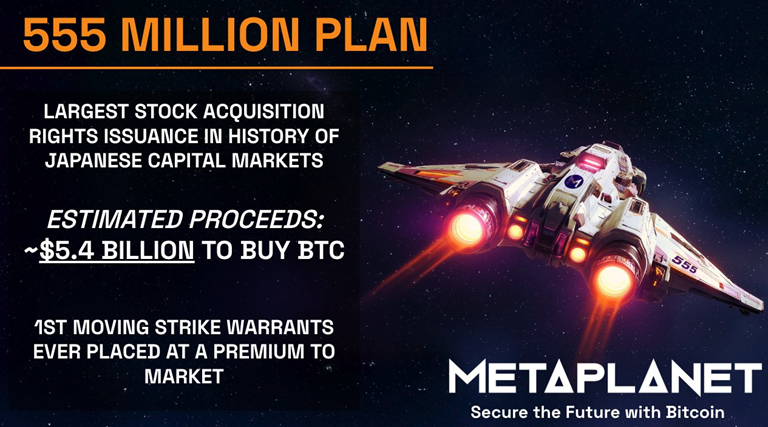
MetaPlanet’s fair value has been bumping up against the 95th percentile fair value, suggesting it may pull back in the coming weeks. But with their new 555 Million Plan locked and loaded, ready to buy $5.4b of BTC, MetaPlanet’s story will continue to be riveting. A few more big bitcoin buys will pump up their fair value.
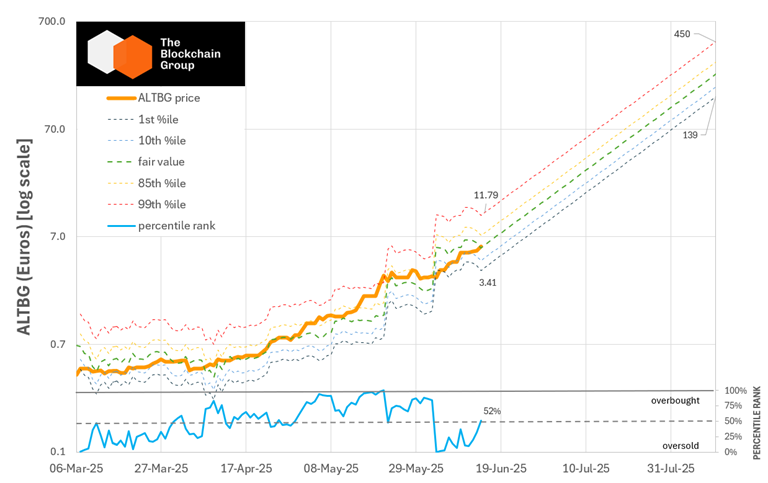
Reasonably Priced with Big Ambitions: ALTBG’s Setup
As MetaPlanet’s aggressive plan unfolds, another fast riser is catching our attention—ALTBG, who now hold 1471 BTC.
Despite their massive growth in share price, ALTBG is sitting pretty much on fair value, with funds raised for some aggressive buys in the coming weeks. Assuming they can keep up their current BTC Yield of 1.5% per day, their fair value chart looks pretty insane.
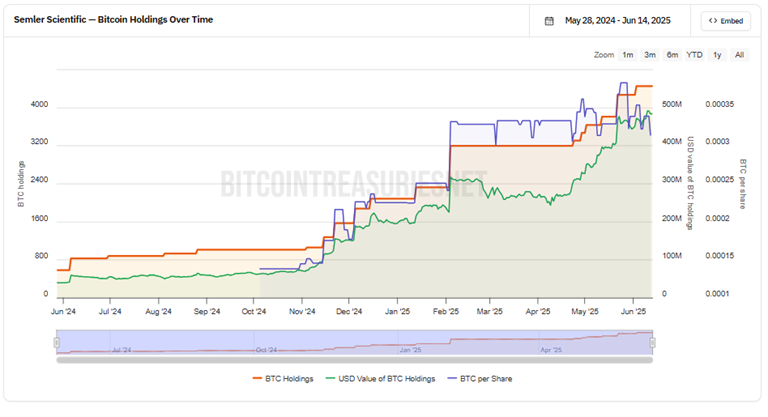
Semler's BTC Strategy: Bargain or Bust?
If you’re a believer in BTC, Semler is starting to look pretty cheap, with a mNAV (including debt) of 1.26! If you didn’t include their debt, their mNAV is sitting at 1.04, so you’re getting the health care company for free!
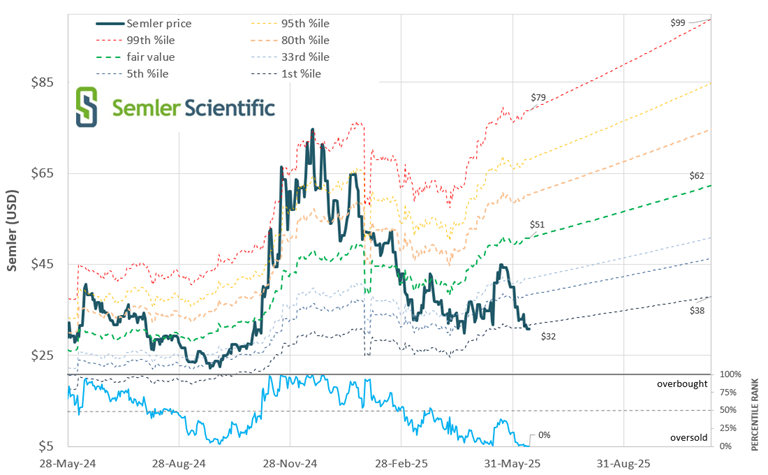
Although their DOJ case has been settled, TradFi investors appear to be concerned about a possible class action lawsuit. However, over the past few months, they have been stacking hard, with a current BTC Yield of 0.2% per day.
So, combined with future growth in the value of their bitcoin holdings, the only way is up for their share price. While they won’t be able to hammer their ATM too hard with such a low mNAV, Semler appears to be a relatively low-risk investment once sentiment improves and BTC rockets, sending the shorts for the exits.
Smarter Web’s Rocket Fuel BTC Strategy—Bubble or Brilliance?
Here’s where things get super crazy!
The Smarter Web Company has been stacking with a breathtaking yield of 9.6% per day, giving them a rock bottom DTC mNAV of 32! They only started trading a month and a half ago, so we don’t have much data, but things start to get even more insane pretty quickly.
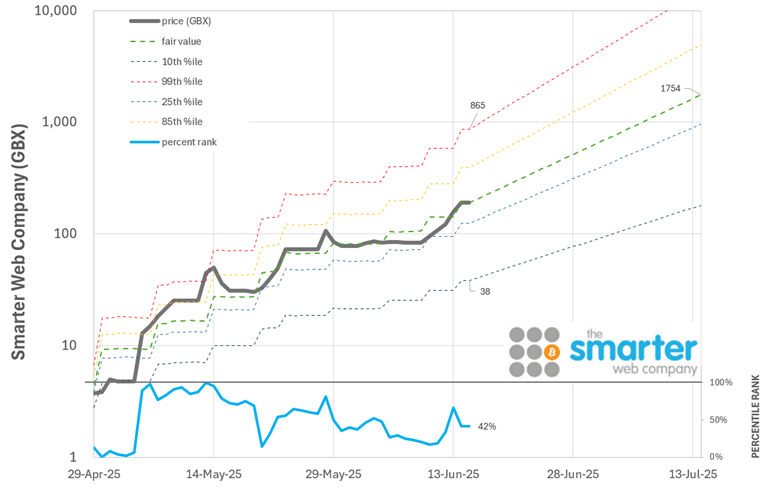
The key downside risk in this story is their high mNAV (currently 19). The market is currently paying a premium for SWC’s incredible rate of stacking. Once this slows, SWC will experience inevitable mNAV compression.
Hopefully, it will be a soft landing! But we highly recommend keeping an eye on the DTC mNAV chart to help manage your risk.
Stack Smart: Balancing Yield, Momentum & Value in Your BTC Picks
While all the data and charts are interesting, the real question is how we should allocate our capital among the contenders in the race to stack as much BTC as fast as possible.
· The fair value charts help us understand where they are in their current cycle compared to their long-term trend, ensuring we don’t buy in when things are overheated.
· Days to Cover mNAV charts help us identify which companies have the most raw power to keep growing their stack and, consequently, their share price.
· Although it slows the potential growth, most people also feel safer with larger companies that have more of a track record and more BTC in their kitty.
The chart below illustrates possible portfolio allocations that balance all these factors. Stay tuned for a detailed article on how all this works.
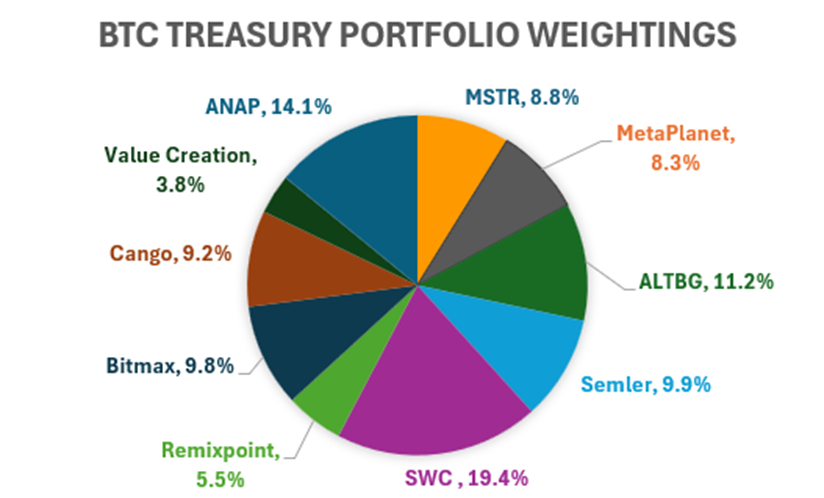
This dynamic portfolio allocation will be continually updated as more data becomes available, helping you preemptively avoid mNAV compression.
Final Thoughts: Your Turn to Weigh In
As the global BTC treasury race accelerates, understanding metrics like DTC mNAV, BTC Yield, and fair value can give you a real edge. From explosive movers like MetaPlanet and Smarter Web to undervalued bets like Semler and MSTR, the field is rich with both opportunity and risk.
At MicroStrategist, our mission is to help you stay ahead of the curve with data-driven insights that cut through the hype. Whether you're a seasoned investor or just diving into the world of BTC treasuries, there’s never been a more exciting time to follow the trends, analyse the charts, and position yourself wisely.
We’re working hard to automate all these charts and insights for both investors and BTC treasury companies. Feel free to let us know in the comments below what you’d like to see us dig into in the future.