Is Bitcoin Winter Cancelled? Why This Cycle Feels Different

Every four years, like clockwork, the Bitcoin crowd gathers around the charts, waiting for history to rhyme, praying for the legendary 'God candle'.

But this time… feels like it might be different.
Cycles that once felt reliable — halvings, annual seasonality, even election-fuelled liquidity bursts — are showing signs of breaking down. Or perhaps, evolving?
After trying to force-fit Bitcoin’s price action into familiar frameworks, I’ve taken a step back.
What happens when you stop expecting the past to repeat — and start watching what’s actually unfolding?
In this article, we’ll explore a new model that blends fundamentals and macro trends — from hash rate and gold to election spending and money supply — to ask the big question:
Are the old Bitcoin cycles dead… or just changing shape?
Let’s dive into what the data is showing — and why this ‘cycle’ might surprise everyone.
From Cycles to Chaos: My Bitcoin Modelling Journey
Soon after I discovered the power of the Power Law, I started trying to model the bitcoin cycles that oscillate around the long-term log-log trend.
I followed @moneyordebt, Giovani, Sina and Plan C and tried to copy and refine, and synthesise everything they were doing into my models.
I developed a model that seemed to use the impact of historical annual, halving and election cycles to predict where Bitcoin might be going in the future.
It was working pretty well until the whole tariff thing appeared out of nowhere in January 2025, and the entire market slumped, including bitcoin. Unfortunately, the model couldn’t see that coming.
If found out the hard way, it can be dangerous to be confidently wrong.
Since then, I’ve been trying to let the market show the way.
I’m not so sure there’s a set-in-stone four-year bitcoin cycle anymore.
Nonetheless, I thought it would be interesting to go back and update the cycles model to see how it was working now. The observations were interesting enough to share.
Quick Take: What You Need to Know
· The impact of the halving cycle seems to be diminishing with time, but the US election cycle drives money flow (liquidity).
· This ‘cycle’ appears to be steadier, at least so far.
· With a larger market cap, less leverage, BTC-TCs competing to buy as much as possible, we may see a longer, slower grind up that largely ignores the traditions of the past.
The Power Law Holds Strong: Bitcoin’s Trend Still Intact
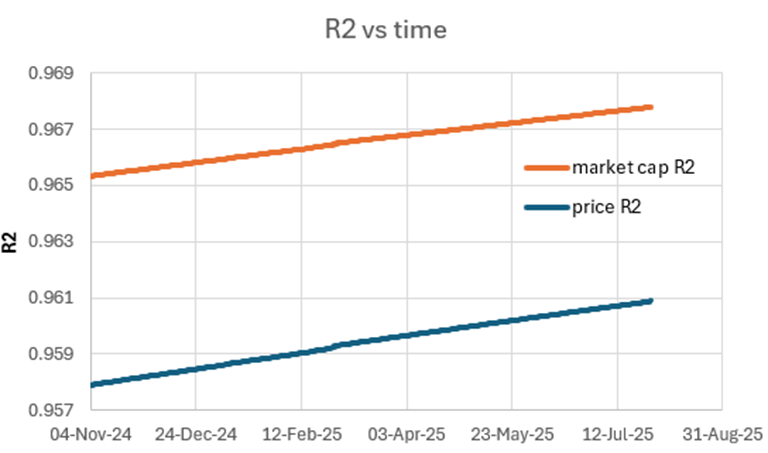
The good news is that bitcoin’s long-term power law trend is still very much intact.
The R2 for both price and market cap continue to climb, meaning the regression is getting even more resilient. As more data comes in, the model only gets stronger.
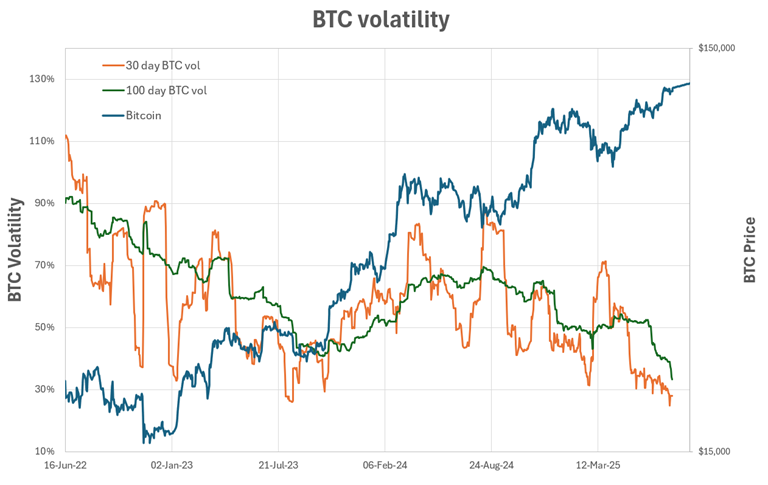
As I’ve mentioned previously, bitcoin’s volatility is decreasing and is now at an all-time low.
However, the gradient of the power law continues to steepen. While the power law quantiles suggest that we may not see $1m BTC by the end of the year, as some other models or hopium pushers predict, the long-term trend forecast price continues to steepen.
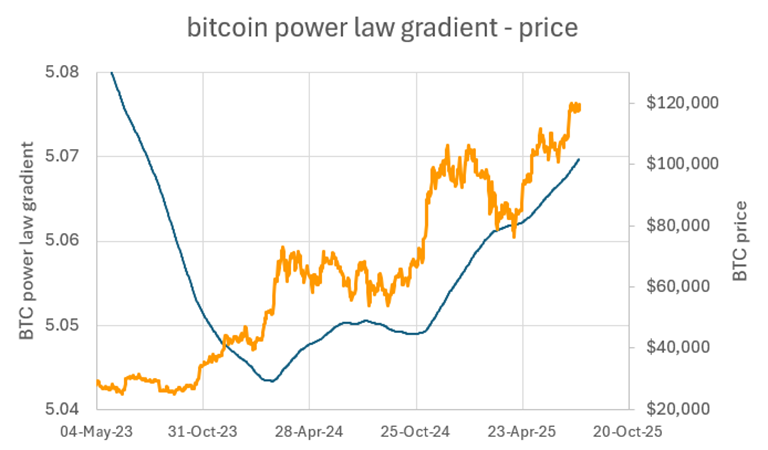
The power law says Bitcoin is currently running at a healthy 35% p.a. CAGR.
Bitcoin’s True Birthday? A Closer Look at Day Zero
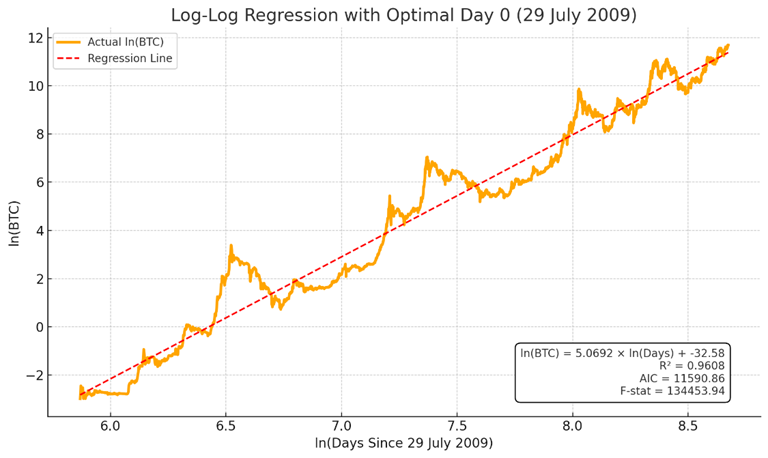
Although the first block was mined on 3 January 2009, it didn’t start to be used as a store of value until sometime later, when it was frequently traded.
As shown in the charts below, R2, AIC, and F-stat are all optimised now with a Day 0 of 29 July 2009.
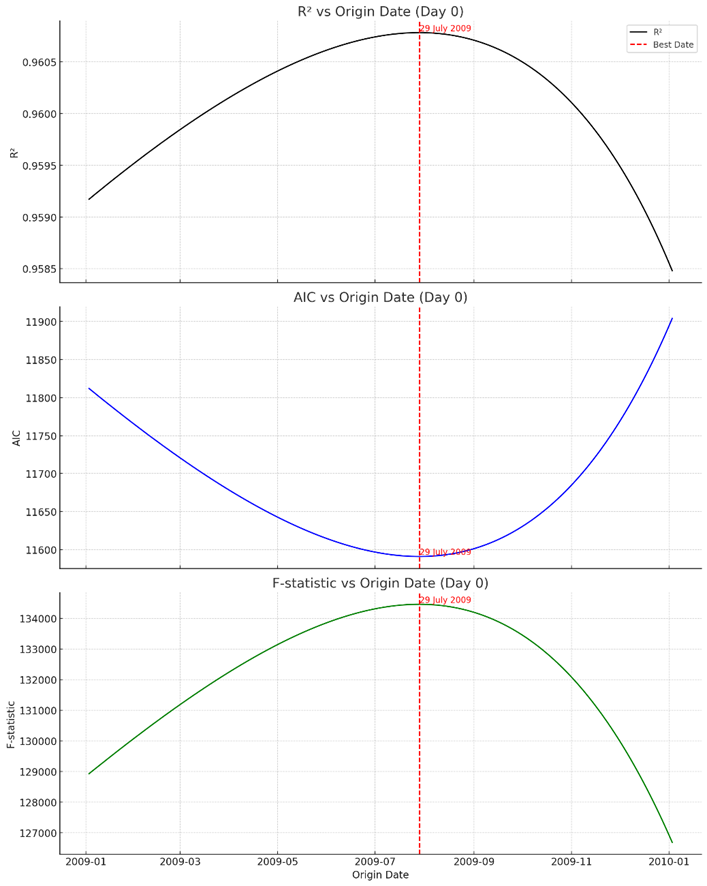
Why do we care? The Day 0 we assume in the model is critical to accuracy, and a more accurate model will give us more robust projections in the future.
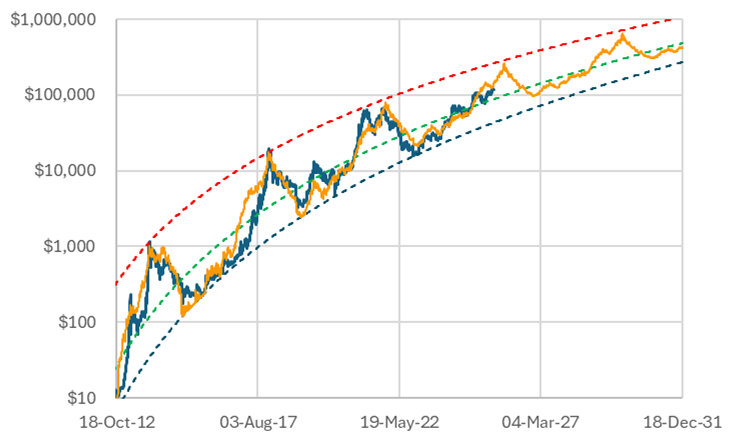
Understanding the Extremes: What the Quantile Bands Tell Us
Looking at the quantile regressions is a great way to understand the likely range of Bitcoin’s price action in the future.
The 0.1st and 99.9th percentile quantile lines capture nearly all of the price action. Projecting these forward gives us a good idea of where we might be heading in the future.
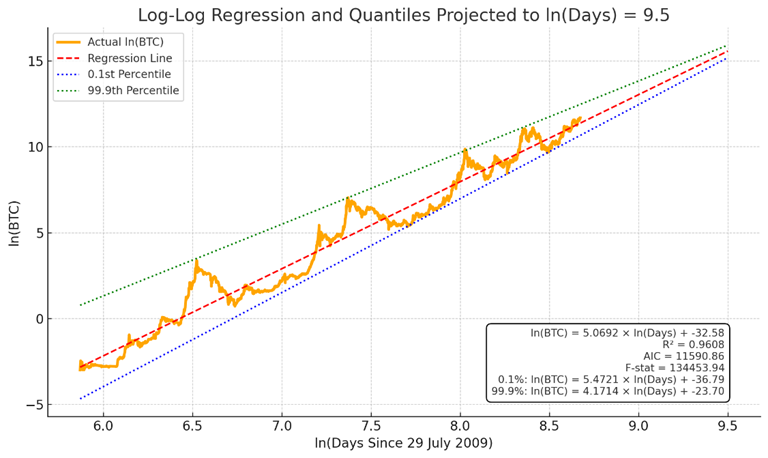
By looking at where the price sits between these lines, we can better understand the cycles.
The chart below shows how the price oscillates between the trend line and the upper and lower quantiles, with zero meaning that we’re at the power law trend, 1.0 is at the 99.9th percentile, and -0.2 is the lower power law quantile (i.e. support).
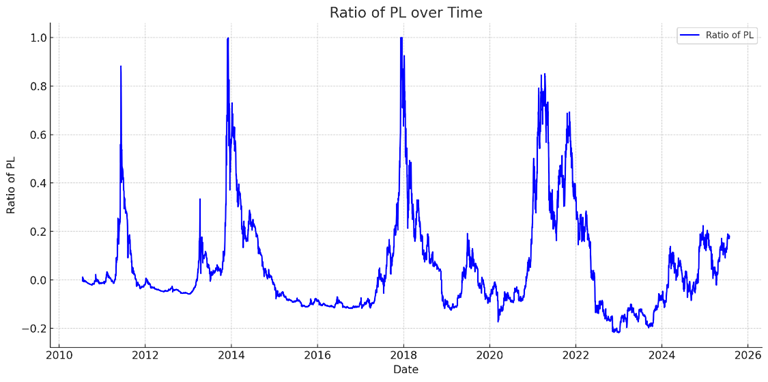
Notice how every four years or so, we’ve seen a spike. IF history repeats, we should be due for one pretty soon. But so far, no overnight ‘omega candles’.
The Annual Rhythm of Bitcoin: What the Calendar Tells Us
The data is super noisy, but we can extract the annual trends in the ratio as shown in the chart below.
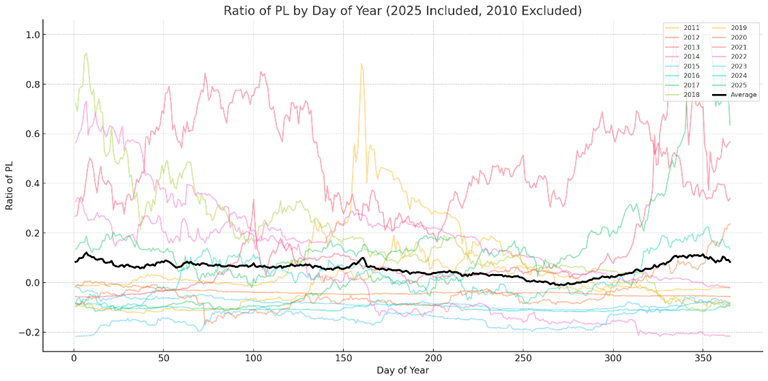
If we take the average of the 15 years of data to date, we see that we often get a trend down through the calendar relative to the power law trend year until we hit “Uptober” and a solid run-up for the rest of the year. The US summer months are often more subdued as traders ‘sell in May and go away’ for holidays.
This could potentially be one of the reasons that we’re seeing a pullback in the bitcoin treasury companies across the board right now, but it’s hard to know for sure.
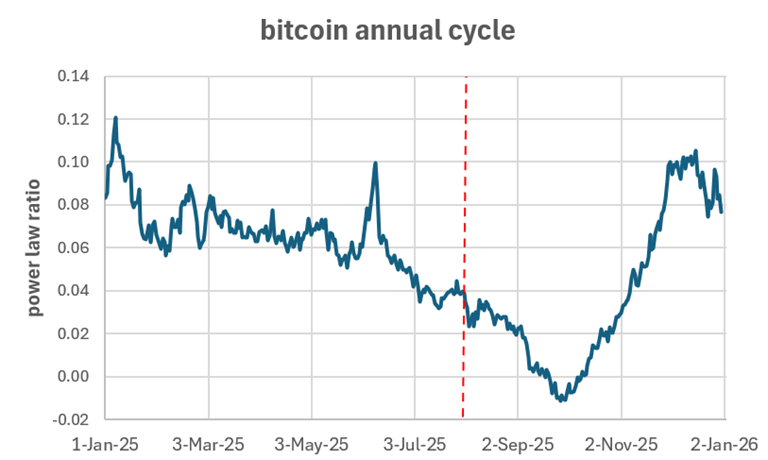
The red line on the chart above shows where we are today. If we just looked at the annual signal, we would say we are in for a couple more months of a downtrend before the annual rip-up.
But the annual trend is only a small part of the story. There are other factors at play…
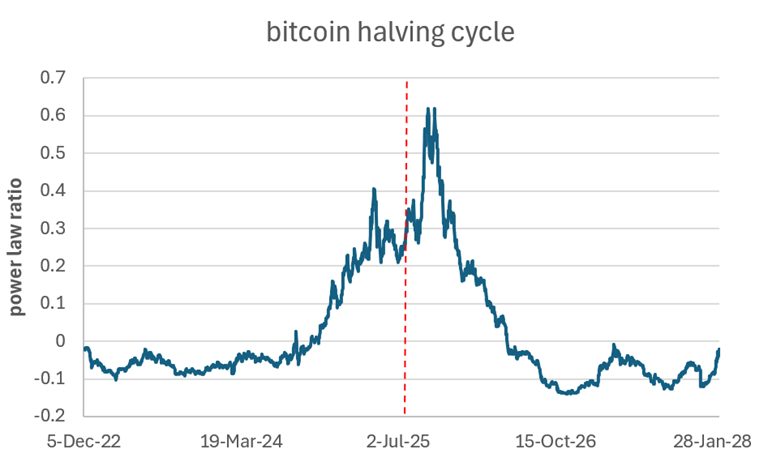
Halvings Aren’t What They Used to Be
In the past, many have believed that the bitcoin cycles are driven by the bitcoin halving, after which the mining supply is halved.
As shown in the chart below, historically, we have seen a peak around 500 days after each halving. But importantly, the size of the peaks related to the halvings has decreased with time. The peak in 2017 was the biggest, with smaller peaks since.
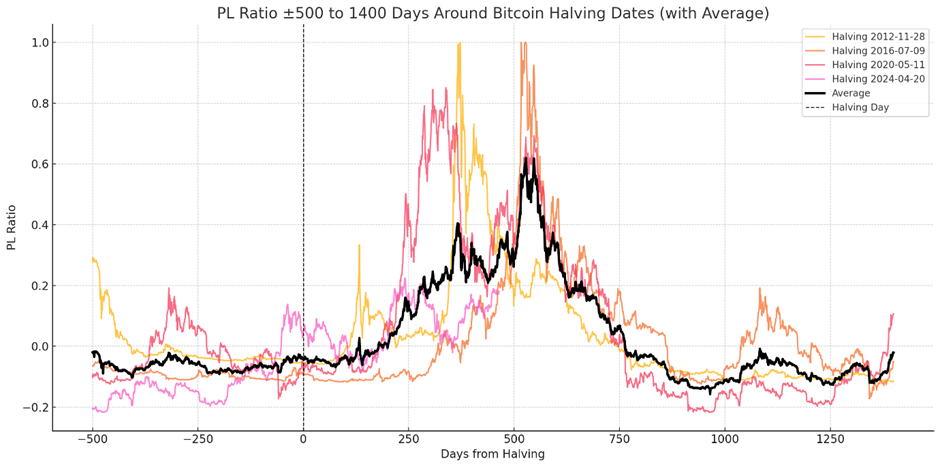
Now that the supply of new coins makes up a much smaller proportion of the Bitcoin in circulation, this impact is likely to be even more muted this cycle.
The halving might still have some effect, but with miners holding onto their coins and BTC-TCs competing to buy much more bitcoin than is being created, we probably can’t rely solely on the halving cycles to understand where we’re going.
The red line on the chart below shows where we’re at in the current cycle, with a peak due in October (yay), followed by a big pullback relative to the power law trend (boo). However, with the impact of the halving cycle much more muted than in the past, this is not the only thing we should be looking at.
Bitcoin and the Ballot: How the US Election Cycles Move the Markets
Perhaps more important than the halving cycle, especially these days, is the US election cycle, which plays a significant role in global liquidity. As the new government gets their spending bills in place, money starts flowing, with a peak 426 days after the election.
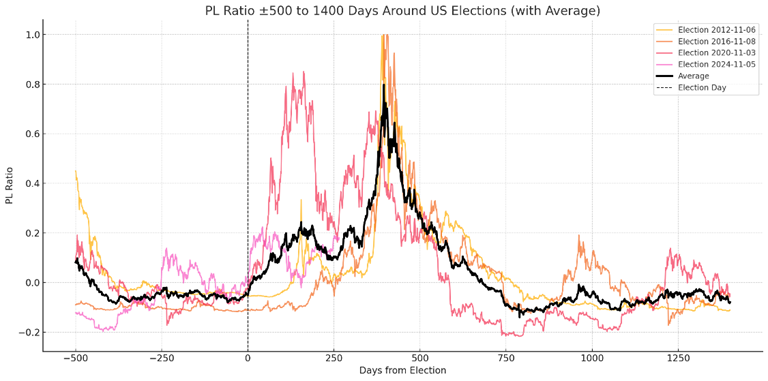
The red line in the chart below shows we are in the current election cycle. If the election cycle history repeats, we’re headed into a flurry of spending followed by a peak on December 5th this year.
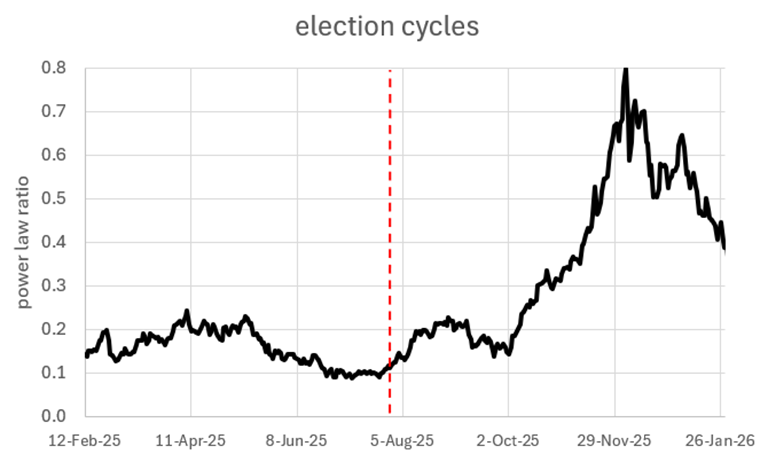
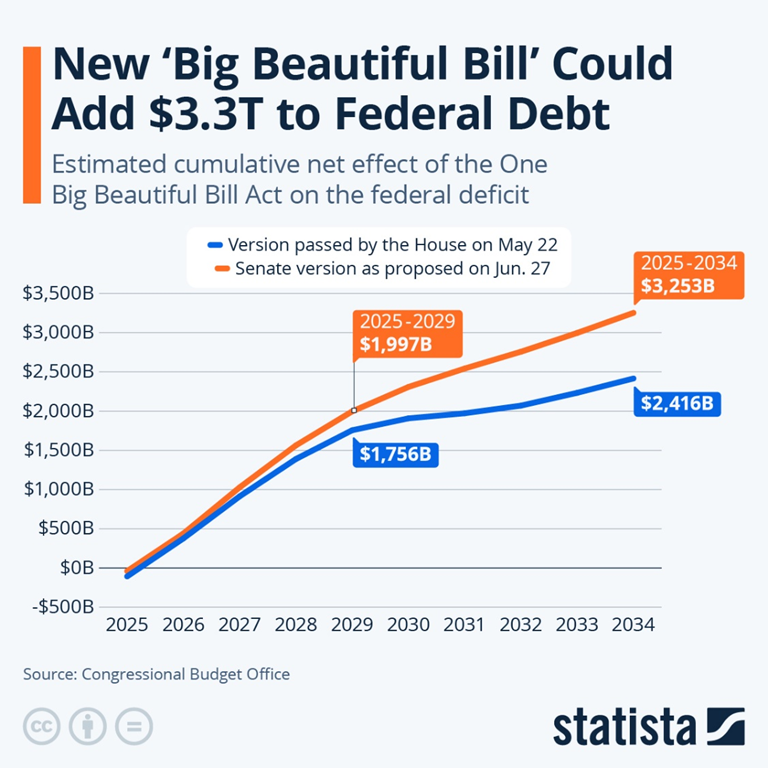
The new ‘Big Beautiful Bill’ definitely doesn’t hold back on the spending, so we could indeed see a solid rise in Bitcoin as it mops up the excess liquidity like a sponge. Any slowdown will be more dependent on whether government funding continues to flow.
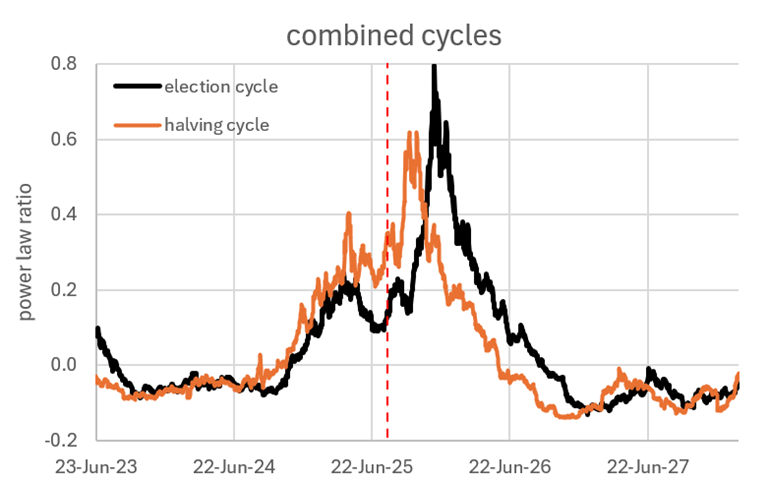
Election vs Halving: Which Drives Bitcoin More?
Another confounder in this analysis is the fact that in the past, the halving and election cycles have aligned fairly closely, so what people attributed to the bitcoin halving may have been the election impact. But as you can see in the chart below, they’re starting to separate, and the data shows that the impact of the election cycle is the largest.
Piecing Together the Puzzle: A Synthesis of Bitcoin’s Macro Cycles
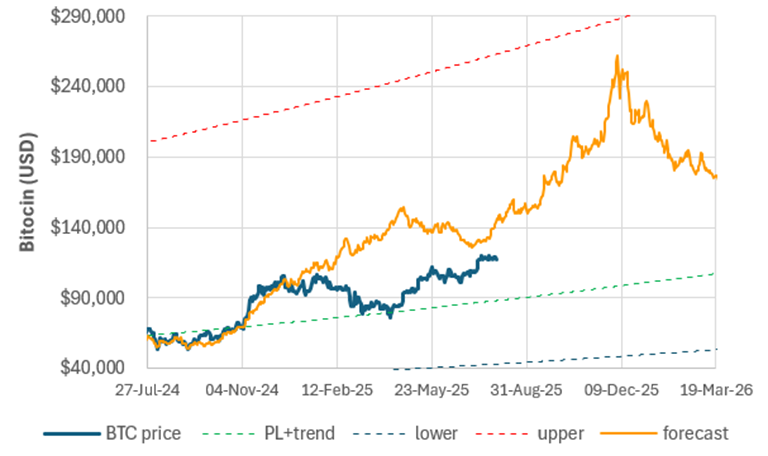
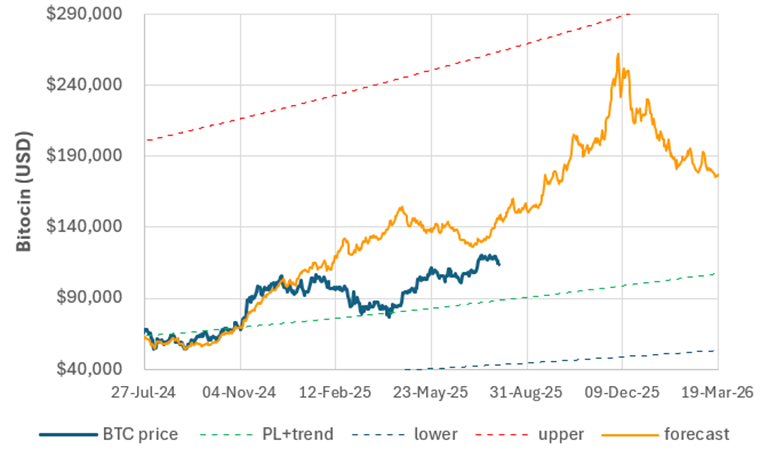
Bringing this all together, we can use the optimised weightings for the election, halving and annual cycle to match the previous data to try to understand where things are going in the future.
When we zoom in, we see that the forecast is running ahead of the current bitcoin price due to the tariff blip and pullback after the US bitcoin reserve that many were hoping for didn’t materialise.

If Trump suddenly announces that the US will be buying bitcoin and holding it forever, or the US dollar completely implodes overnight, we could see a rapid rip up. But, in the absence of any substantive news, I think bitcoin will continue to grind up, staying well above the power law trend without the extreme euphoria we’ve seen in previous cycles, when retail could move the market.
The cycles are not necessarily baked in or predestined.
Now, with Bitcoin at a 2T market cap, we need companies and countries to continue to buy more Bitcoin. And unlike highly leveraged retail, companies and governments are less likely to get a margin call that will force them to dump their coins and tank the market, as seen in previous cycles.
There’s no way of knowing for sure where all this is going in the short to medium term. Being confidently wrong is often worse than just going with the flow. But in the long run, it’s going up forever (Laura).
Implications for Bitcoin Treasury Companies: Who Survives the Grind?
Bitcoin Treasury Companies have been the hottest topic in the space lately, because they can use the debt and equity markets to stack bitcoin faster than individuals, and without risk of a margin call. But be aware, they will be punished in a bear market, due to the compounding of the Bitcoin price decline and mNAV implosion.
There’s a good chance we’ll see a continued grind up, with some temporary pullbacks in Bitcoin and BTC-TCs that will weed out the weaker, smaller ones and leave a handful that can offer collateralised bond products to continue their BTC Yield engine as they grow beyond the stage they can rely on their ATM to harvest funds from the equity markets.
If we do get a rip up towards the upper quantile (e.g., $300k by the end of the year), then it would be smart to de-risk and move your money to something more stable (e.g., bitcoin, Gold, STRC, STRF, STRD, etc.). But if enough people move from BTC or BTC-TCs to BTC-TC preferred who keep buying bitcoin… the next ‘bitcoin winter’ may be a non-event.
Final Thoughts: Cautious Optimism in a Maturing Market
If the bitcoin price follows previous cycles, we’re in for a lot of fun over the next few months.
But, in the absence of significant news, we could continue to grind up with less volatility and without the bitcoin bear market that we’ve seen in previous cycles. Lower volatility and more stable growth will accelerate wider adoption and continued growth.
While models are useful, they’re all wrong to some extent. We need to stay vigilant and be ready to adjust to the conditions as they unfold.
Have fun, stay safe. We’ll keep bringing you the data and analysis to make informed decisions.
What do you think comes next? Will Bitcoin keep grinding up, or are we due for another surprise? Drop your thoughts in the comments below — we’d love to hear your perspective!