Rocket Fuel or Vapour? What the Shape of BTC Growth Tells Us for BTC-TCs


People love watching rocket launches.
Why?
Because you never really know what's going to happen — will they soar to the moon, drift aimlessly, or explode on the launch pad?
The same goes for Bitcoin treasury companies (BTC-TCs). Early excitement is thrilling, but it’s what happens after takeoff that really matters.
At first, everything looks like exponential liftoff.
But over time, trajectories diverge. Some BTC-TCs hit escape velocity. Others stall. And eventually, all must reckon with the limits of fuel — or, in this case, capital.
So, how do we figure out which rockets still have fuel in the tank — and which are about to lose their battle with gravity?
That’s where growth trajectory modelling comes in.
Charting the Climb
Getting rapid feedback on X is great.
When I first started sharing and posting the Bitcoin Stacking Race chart, a lot of people loved it, but astute observers called BS on the exponential trend lines.
Regardless of their current trajectory, MetaPlanet are unlikely to overtake Strategy by early 2026.
And then there are all the companies that are on track to buy ALL the bitcoin, based on a simple exponential trend line in short order:
· MetaPlanet – 9 December 28
· ALTBG – 19 Nov 2026
· H100 - 24 December 2025
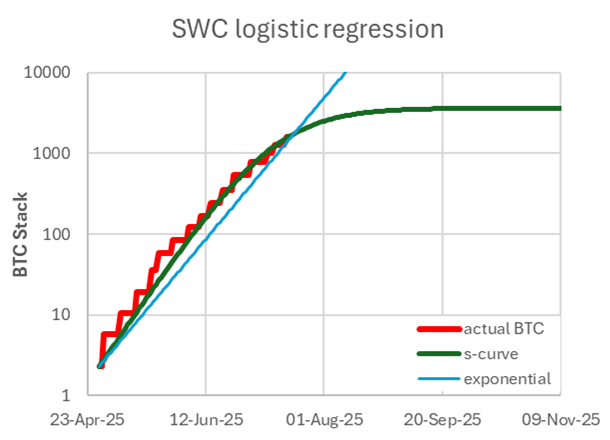
· SWC – 13 November 2025
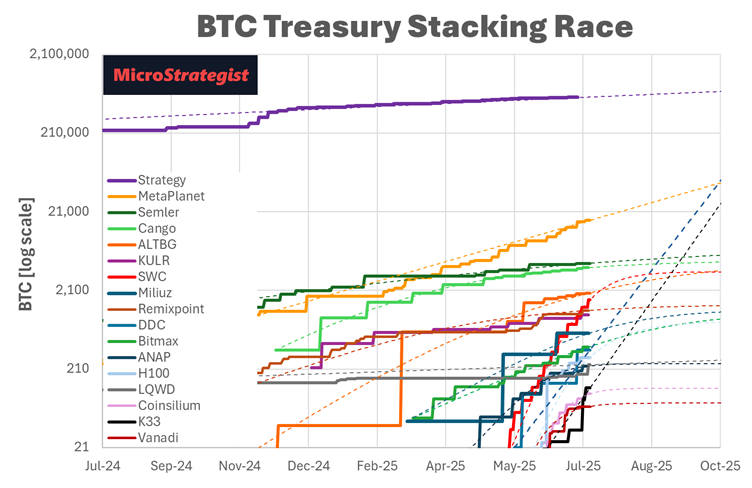
This exponential growth has to slow, but when?
Trajectory Is Destiny
Understanding where your BTC-TC’s BTC stack is headed is not just fun, like cheering for your favourite sports team.
BTC growth is everything.
While bitcoin may be forever, you don’t have to pledge until death do us part to your favourite new BTC-TC.
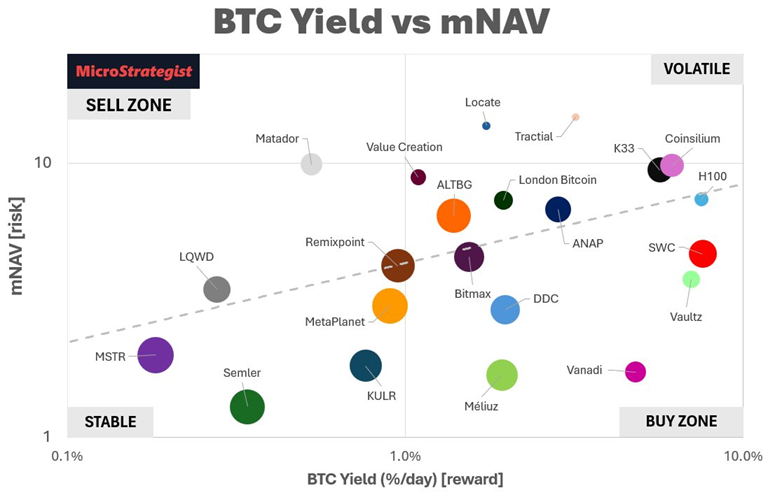
Investors pay a premium for BTC Yield (growth in BTC per share), and once that drops, the mNAV premium implodes.
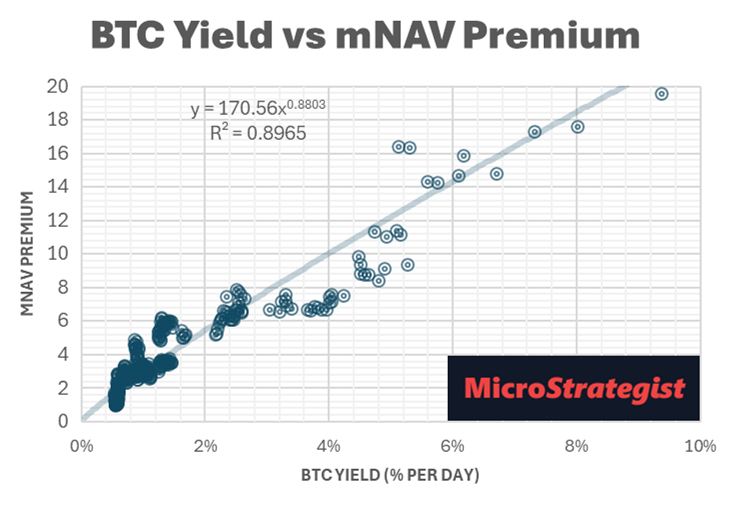
If you’ve boarded a rocket that suddenly runs out of gas not too long after launch, you’re in trouble! The mNAV that fuels these companies is a double-edged sword!
Astute investors will want to see a consistent track record of sustainable BTC Yield with regular BTC purchase announcements. Many investors will pull the ripcord at the first sign of BC Yield slowing, leaving the die-hards holding the bag.
If mNAV compression happens faster than BTC rises, the share price is headed south.
Fine-Tuning the Forecast: Why Shape Matters
I was excited to add the logistic (S-curve) regression, which helps us project a company’s future BTC stack based on its current trajectory.
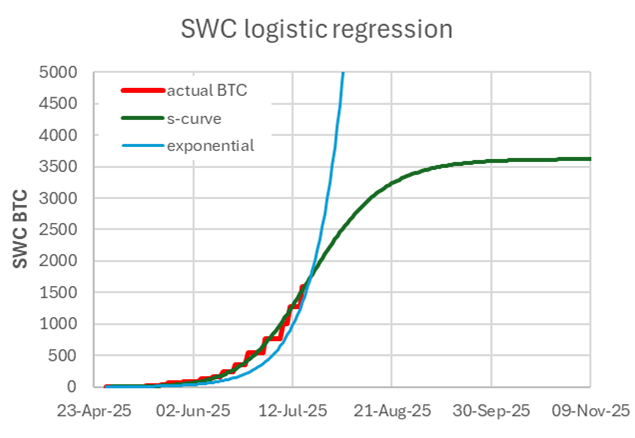
However, I received a ton of ‘constructive feedback’ from the SWC community, so I dug a bit deeper and discovered the generalised logistic functions (aka ‘Richard’s regression’), which adds a shape factor to the logistic regression and gets a better fit with the existing data.
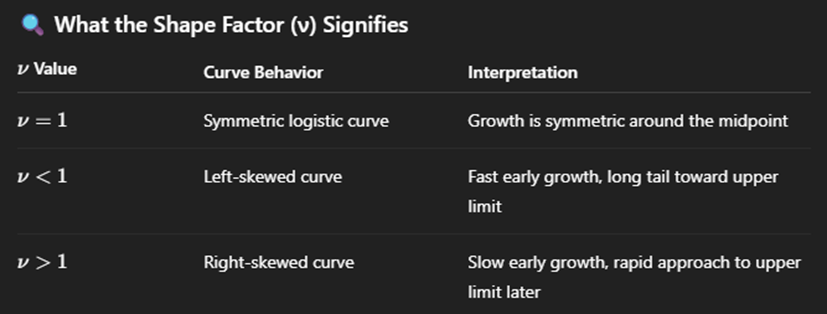
The key aspect here is that the shape factor helps us identify a company that is either front-loading or back-loading its growth. A company that is pumping its stack with early IPO investor funding will have a lower ‘shape factor’ (v), while a company that has organic initial growth.
Late Bloomer vs Mini Rockets
I know this is getting a bit nerdy, but I think the detail is helpful.
The table below shows the results of the regression analysis, sorted by the shape factor. The same factor is calculated as part of the regression analysis, optimised to maximise R2.
These metrics help forecast which BTC-TCs might flame out vs. those with staying power.
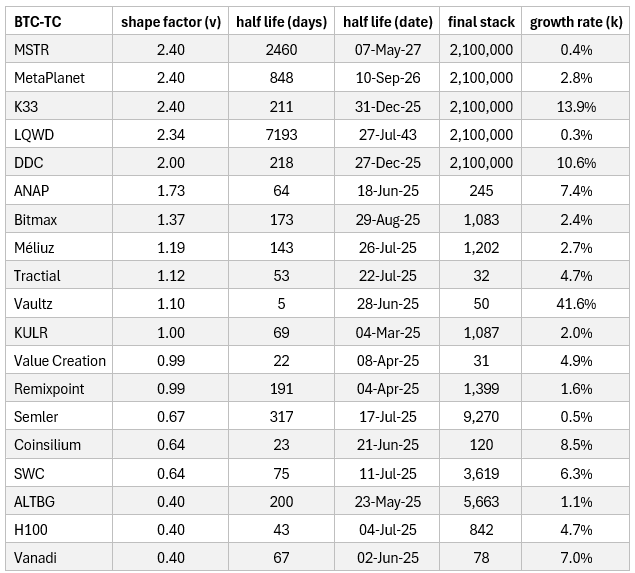
At the top of the table, we have the big boys — MSTR and MetaPlanet — who have consistently grown their stack over the long term.
While their growth rate is lower, they’re currently moving faster than their long-term exponential growth rate, so there’s no sign of them slowing down (yet) before the 2.1m BTC limit set in the model. However, if their ability to fund new BTC purchases slows for any reason, the model will turn.
Meanwhile, companies towards the bottom of the table may have started stacking at a rate that is too hot not to cool down.
The $100b question is when.
Slow Burners with Staying Power
LQWD is an interesting example of a late bloomer, with a higher shape factor (2.34). It has been stacking BTC since November 2023, but only recently received VC funding via UTXO, with its stack growing rapidly over the past few weeks. While its long-term growth is slower, it has no signs of slowing down, yet.
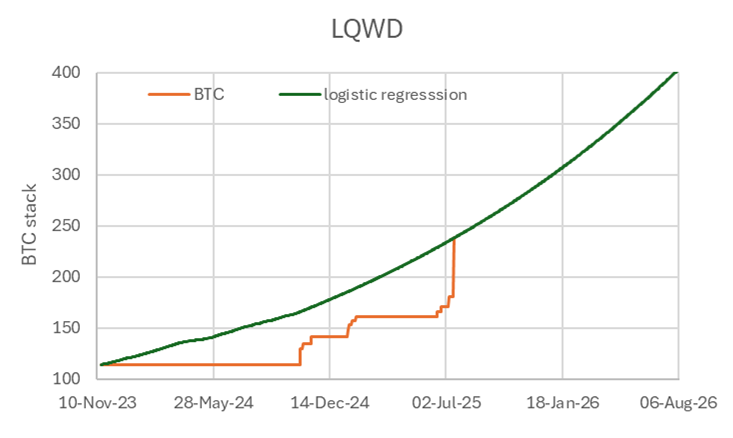
But because its BTC stack was already relatively large compared to some of the BTC-TCs that received an early VC funding stimulus, their BTC Yield is relatively low. It will take a lot of cash to pump the BTC Yield to move their ‘bubble’ to the right on our chart.
The current trend shows that, if the VC cash injections continue, there is no reason they can’t reach 2.1m BTC. However, as soon as the VC cash injections slow, the logistic regression will roll over and give us a more accurate prediction of their final BTC stack and the slowing BTC Yield.
Then we have MetaPlanet, which has grown slowly and steadily since it started stacking in May 2024. Right now, there is no difference between the exponential and logistic projections.
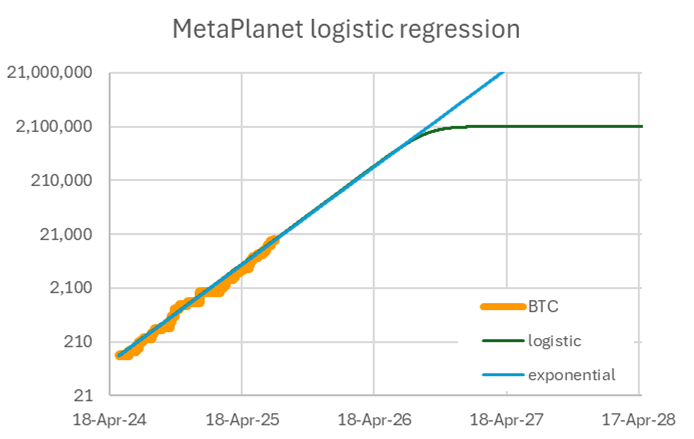
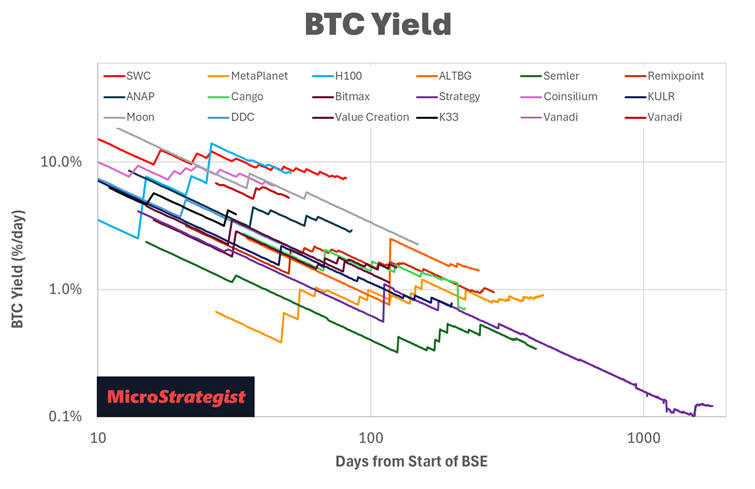
While it’s impossible to predict the future, we can use the projections to understand when things might slow down. The chart below illustrates the growth rate (green line) based on the logistic regression model.
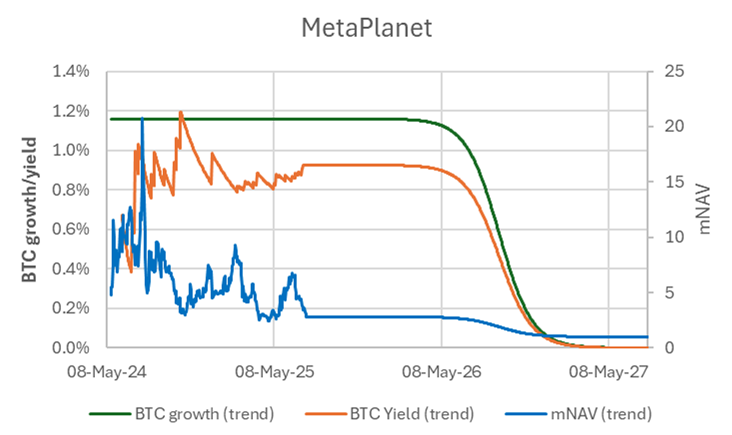
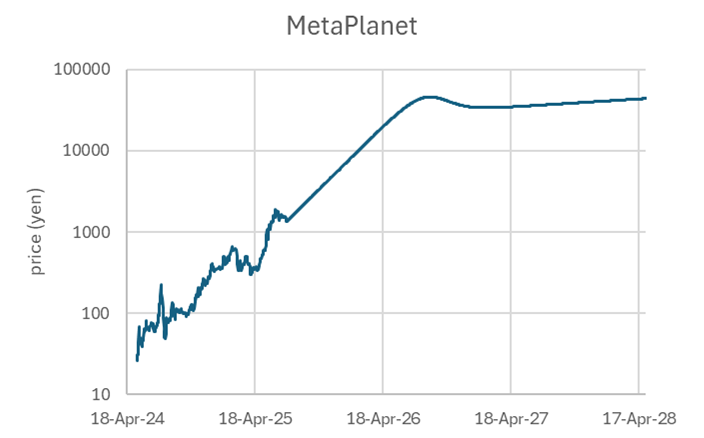
Because even MetaPlanet can’t get unlimited BTC, the chart shows the rollover of BTC growth starting in September 2026. We can then use this to infer the change in BTC Yield and mNAV from current values.
Based on this, we can project the future trajectory of MetaPlanet, with a small decrease in price before the growth in BTC picks up and drives the price higher.
When Early Hype Meets Gravity
In contrast, stratospheric early growth leads to a sharper mNAV crash when momentum fades.
At the other end of the spectrum, we have H100, which made some early BTC purchases, but these have become smaller in recent weeks.
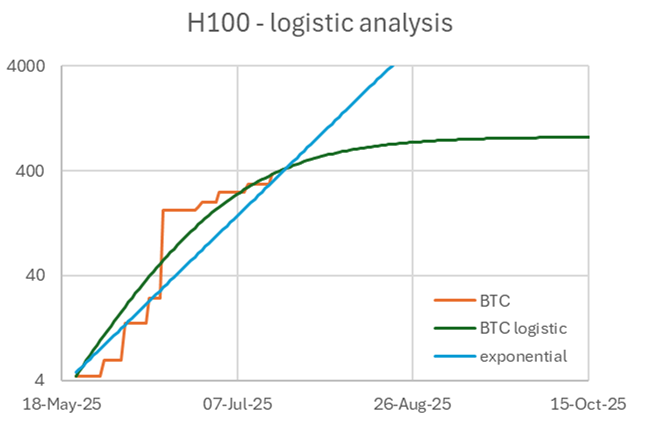
VC investor funding wants to get in early at IPO at lower prices than retail can access. Then retail steps in, and they turn to the ATM. Without sufficient momentum and liquidity, they might struggle to continue the same growth trajectory. If growth starts high, everything has to fall into place quickly – VC funding, retail, ATM, preferereds. If they’re moving too fast, it’s much easier to lose traction at any of these sticking points.
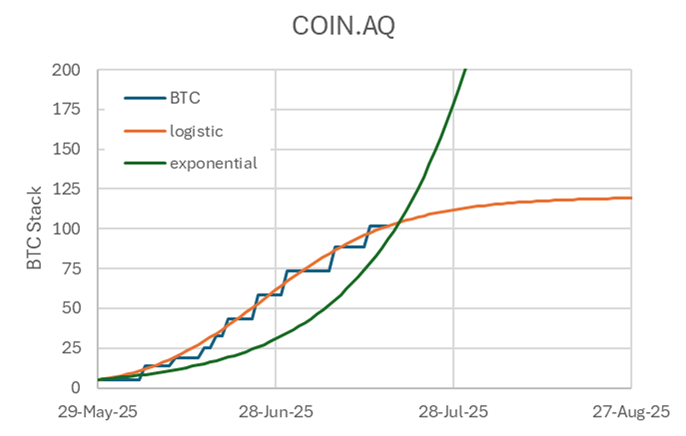
Consilium is another one that has come out of the gate swinging, driving their mNAV up to 92 at its peak. However, growth has slowed more recently, with its mNAV dropping back to less than 7.
Green Lights… For Now
Then we have the newcomers, who are looking great, but only time will tell if they can maintain this pace.
Our portfolio allocation model currently favours DDC because the logistic growth is currently outpacing the exponential growth curve. The market has also responded, with its price rising from $3.81 when they started buying BTC on 23 May to a peak of nearly $20.
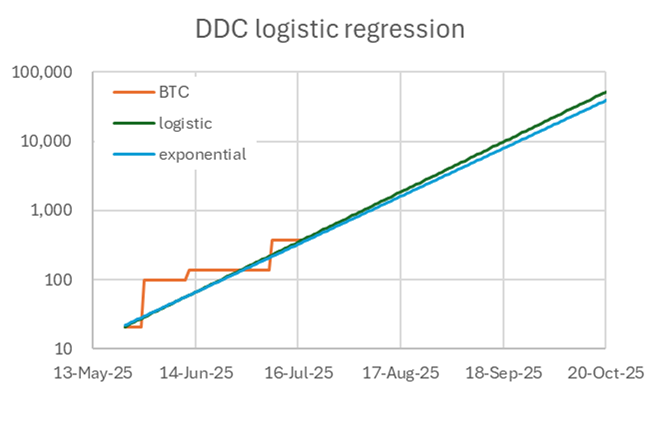
For now, things look promising, with a ton of cash lined up to continue buying, but again, time will tell. Everyone talks big, but it’s best to rely on data. The logistic regression model will highlight when their BTC Yield rolls over.

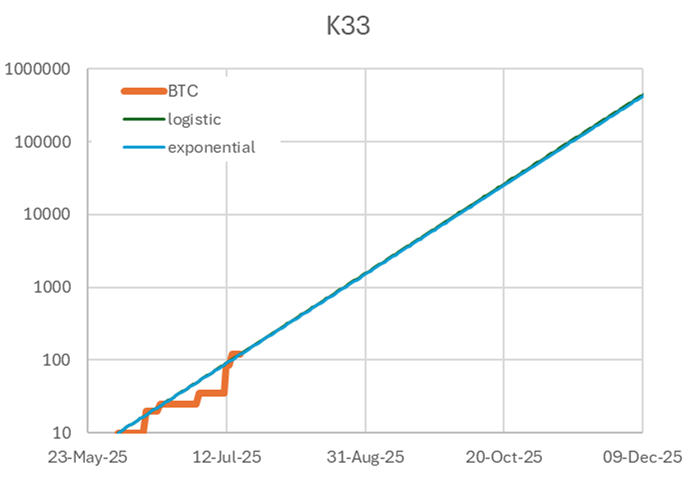
Similarly, K33 has been on a tear buying BTC aggressively, but as soon as they slow down the market (and our model) will punish them.
Grab the popcorn!
How to Use This Insight
So, the takeaway of all this nerdy analysis is that some BTC-TCs will front-load their BTC buys (as indicated by a lower shape factor in the logistic regression).
This benefits early investors who get in at the IPO, but may leave retail investors more exposed to mNAV compression later, when growth slows.
Meanwhile, companies that grow more slowly and sustainably will leave investors joining later less exposed to mNAV compression.
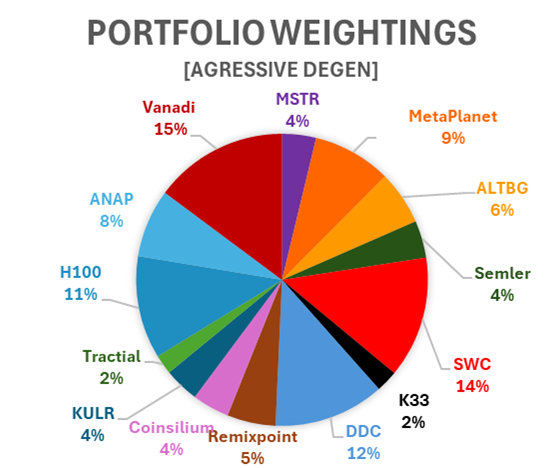
Our aggressive portfolio allocation is designed to capture the early growth of rapidly expanding companies. Although the important caveat is that their initial pace may not last forever.
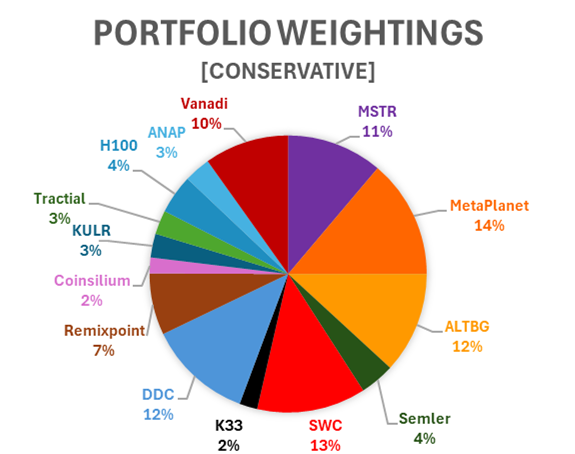
Meanwhile, our conservative portfolio
Meanwhile, our conservative portfolio allocation is designed to minimise the risk of future mNAV compression by avoiding companies with a short track record or whose growth is slowing.
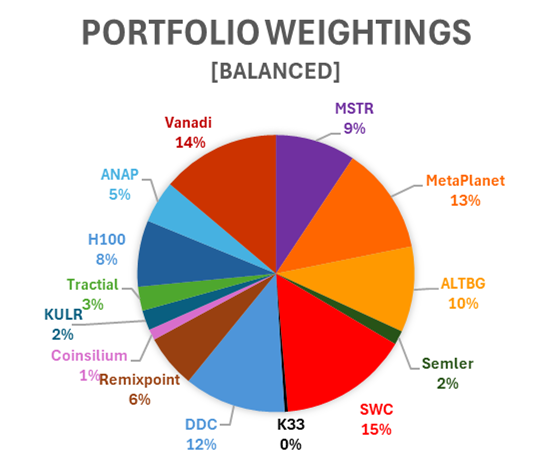
And the balanced portfolio strikes a balance in the middle.
Final Descent or Soaring to the Moon?
· No model can accurately predict the future.
· With limited BTC, growth must slow eventually. Exponential growth is unsustainable.
· Logistic regression tries to forecast their ultimate BTC stack based on the trajectory of their stacking.
· The shape factor in the generalised regression helps us understand whether a company is stacking too fast, not to slow down soon, or whether it’s just getting started with a lot further to run.
· Early-stage investors may want to monitor the shape of the BTC stacking trajectory closely to decide if they need to bail out.
· Companies that grow their stack consistently at a sustainable rate are likely to be growing in the long term. Meanwhile, smaller companies that go hard early will have higher initial returns, but a greater risk of mNAV compression in the near term.
The question isn’t just who stacks fastest — it’s who can sustain it long enough to land safely.