The Business Cycle Bitcoin Amplifier


Many factors appear to correlate with Bitcoin’s moves, like:
· halvings,
· election cycles,
· gold,
· global liquidity (M2),
· the hash rate, and
· the S&P 500.
But, when you remove the noise, which of these truly matter?
Our latest analysis suggests the ISM Purchasing Managers’ Index (PMI) — a key gauge of the business cycle — may be the most powerful amplifier of Bitcoin’s major moves.
TL;DR Summary
· PMI tracks Bitcoin cycles better than halvings.
· Liquidity (M2) and hash rate form the core model.
· Business cycle recovery could signal Bitcoin’s next leg higher.

The PMI: Bitcoin’s Hidden Macro Metronome
The ISM Manufacturing PMI measures U.S. industrial health.
It’s derived from monthly surveys of purchasing managers covering new orders, production, employment, supplier deliveries, and inventories.
· PMI > 50 → Expansion
· PMI < 50 → Contraction
Because manufacturing reacts quickly to demand changes, PMI often leads broader GDP growth and inflation trends — effectively mapping the business cycle itself.
When plotted against Bitcoin, the PMI’s peaks (blue line) line up closely with Bitcoin’s cycle tops, while troughs align with macro bottoms. In short, the business cycle, along with a few other factors, helps explain Bitcoin’s rhythm better than the four-year halving narrative ever did.
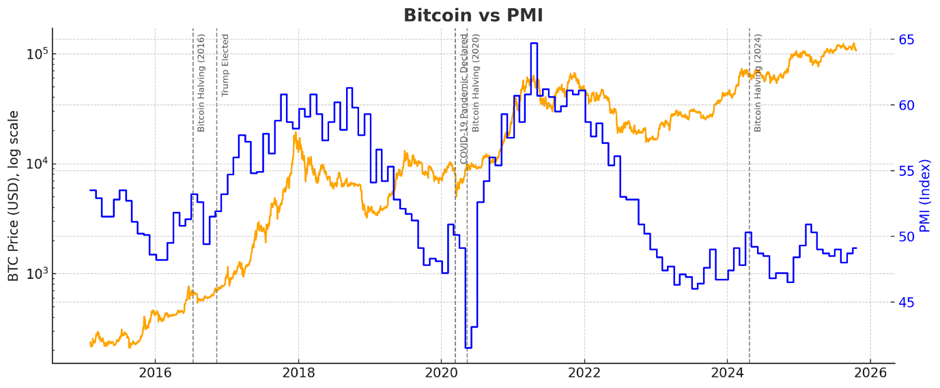
When PMI rises above 50, Bitcoin historically outperforms — not because of halvings, but because liquidity and optimism return simultaneously.
The Drivers Behind 2018 and 2021’s PMI Surges
The PMI peaks that amplified Bitcoin’s previous two bull markets were each powered by distinct macro forces.
· 2018: The post-2016 industrial rebound was driven by the Trump administration’s tax cuts, deregulation, and a synchronized global recovery. The “Trump Trade Boom” pushed U.S. manufacturing confidence to its highest level since 2004, with PMI readings above 60. Capital spending accelerated, commodities surged, and global liquidity remained abundant — all ingredients for Bitcoin’s late-2017 mania.
· 2021: The second major PMI spike followed the COVID-era stimulus explosion. Trillions in fiscal aid, ultra-loose monetary policy, and supply-chain bottlenecks created a demand shock. Manufacturing backlogs soared and inflation expectations surged, sending PMI again above 60. Bitcoin, reflecting that liquidity surge and inflation fear, rocketed to new highs — peaking just as PMI began to roll over.
In both cases, Bitcoin’s strongest gains coincided with the “boom” phase of the business cycle — when liquidity, demand, and optimism all expanded faster than the economy could absorb them. While the Fed is trying to keep a responsible lid on rates, Trump is back and looking to drop interest rates to let the economy ‘run hot’ repeat before the upcoming midterm elections.
These surges didn’t just lift factories — they ignited Bitcoin’s biggest bull runs.
Halving Cycles Are Dead — Or Just Misunderstood?
In the chart above, we can see that the 2016 and 2020 halvings occurred close to the start of the next jump in the PMI, so it’s no wonder so many believe that the bitcoin peaks follow the halving cycles.
The orange line in the chart below illustrates what the bitcoin price might do if halving cycles were ever a thing, featuring a leveraged-driven peak in November, followed by a massive crash into 2026. It’s possible that Bitcoin’s current sluggish growth could be partially driven by long-term holders believing the halving cycle peaks will repeat and trying to derisk.
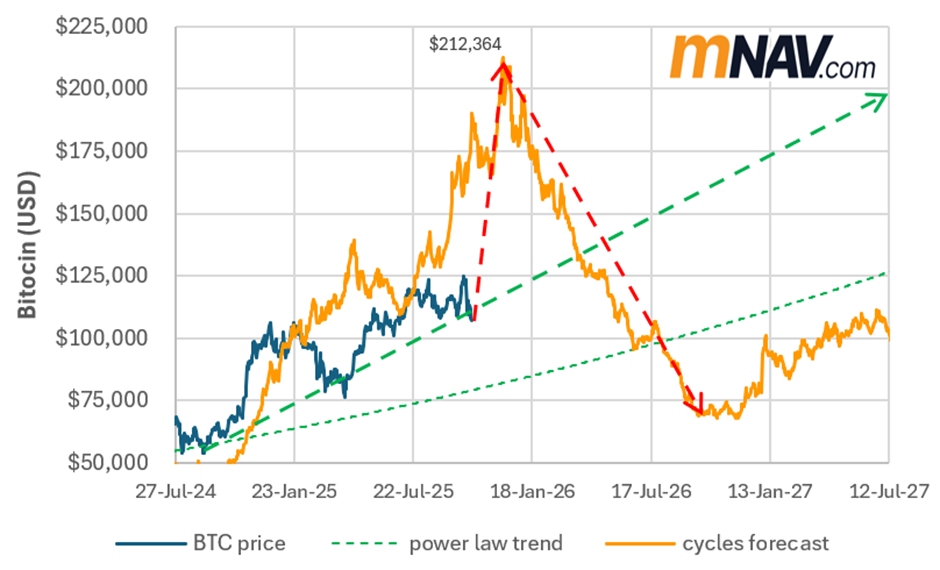
However, it seems that Bitcoin is largely ignoring the halving cycle beliefs and continues to grind up, keeping just above the power law trend.
Gold’s Glow vs. Bitcoin’s Fire
Gold has drawn renewed attention lately as nations such as China and Russia diversify away from U.S. Treasuries.
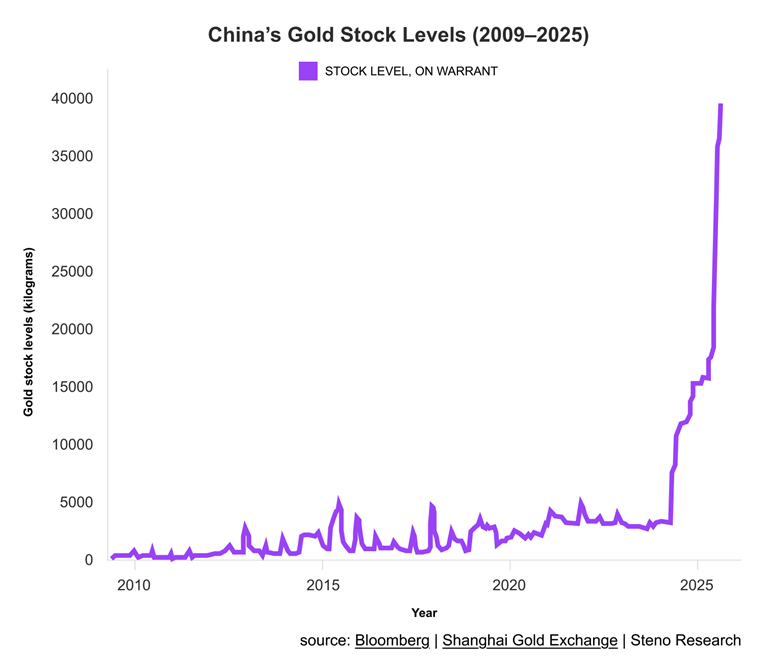
The resulting price surge in Gold since late 2022 has been dramatic.
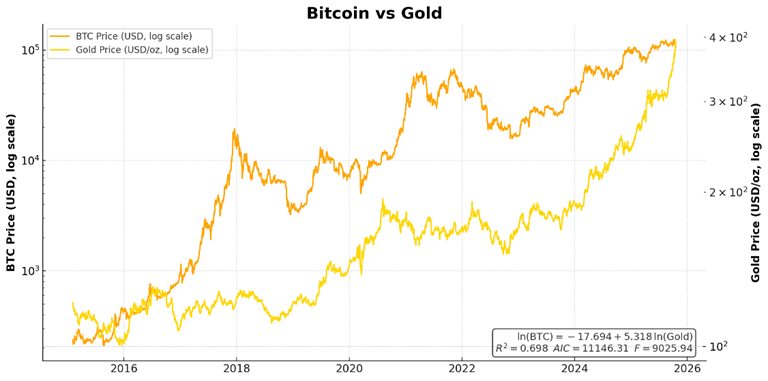
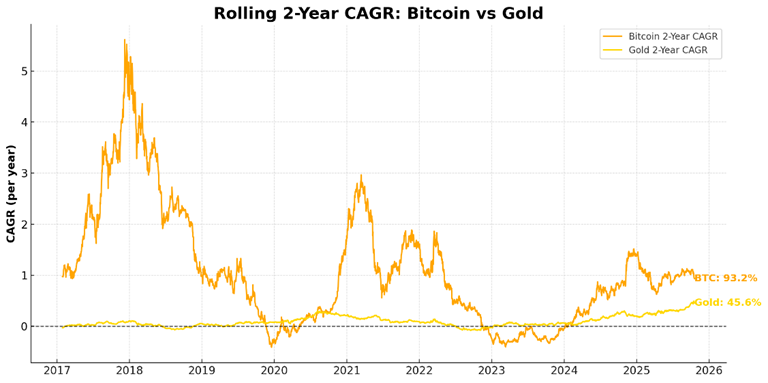
We often call Bitcoin “digital gold”, yet the correlation isn’t particularly tight (R² ≈ 0.7). Both assets are part of the debasement trade. While many bitcoiners are getting FOMO watching the gold chart, even over the past two years, while gold has been on a tear, Bitcoin’s current rolling 2-year CAGR of 93 % dwarfs gold’s 46 %.
While speculative theories swirl about gold revaluation or U.S. monetary pivots, the key takeaway is this: Bitcoin, with a smaller market cap and many superior properties, still responds far more dynamically to liquidity and growth expectations than gold does.
While the BRICS nations aren’t buying Bitcoin right now like they are gold, many, like Luke Grooman, still believe that Bitcoin will outpace gold over the long term.
M2: The Liquidity Engine Behind Bitcoin
M2’s correlation with Bitcoin is striking (R² ≈ 0.9).
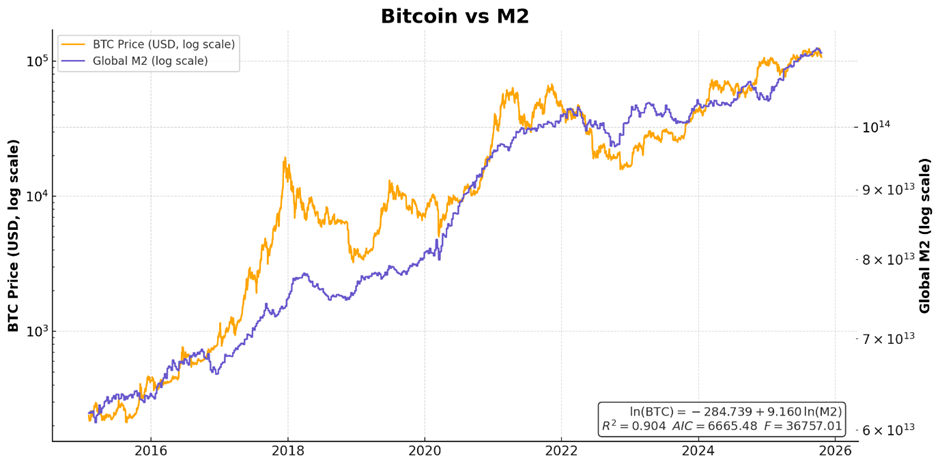
Bitcoin acts as a liquidity sponge — absorbing excess money when global liquidity expands. M2 exploded after COVID until early 2022, but has been on a bit of a bumpy ride as reserve banks have tried to put the liquidity genie back in the bottle, for now.
In fact, while many like to look at the alignment in some of these charts over short periods, we don’t see any convincing evidence of lead/lag relationships when we look at all the data available for M2 or any of these other indicators.
Unfortunately, it’s hard to predict the future using current data, but it can help us determine whether BTC is over- or undervalued based on other macroeconomic factors.
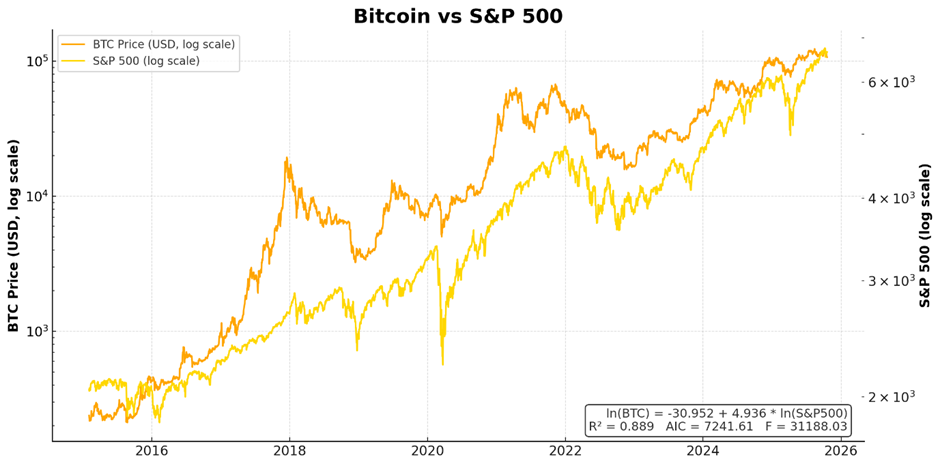
The S&P 500: Bitcoin’s Risk Appetite Mirror
Bitcoin also tracks the S&P 500 closely (R² ≈ 0.89), reflecting shared exposure to liquidity cycles and investor risk appetite. When monetary conditions loosen, both equities and Bitcoin benefit.
Hash Rate: The Strengthening Pulse of Bitcoin’s Network
Bitcoin’s hash rate maintains the strongest single correlation (R² ≈ 0.93). It’s also a factor that isn’t tied directly to the broader economy, which is all interrelated (i.e., colinear).
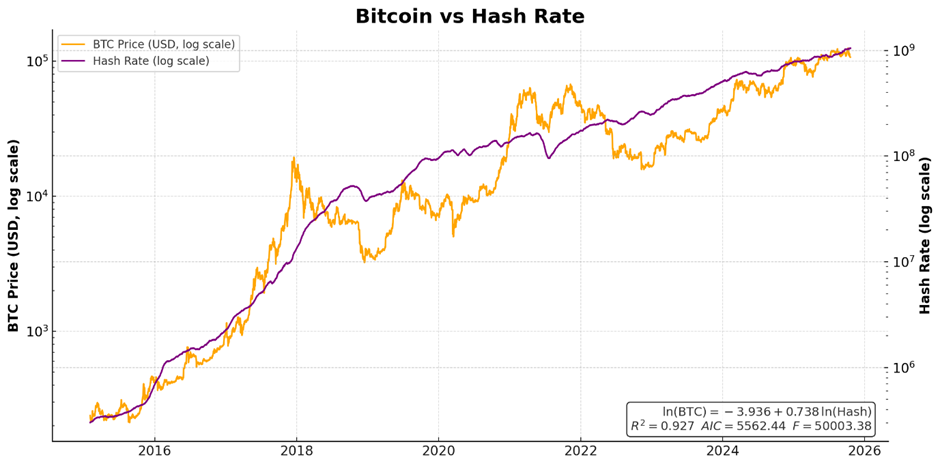
Rising prices incentivize miners to deploy more hardware, which increases network security — a powerful positive feedback loop between price and security.
While hash rate experiences occasional dips during major BTC pullbacks as miners struggle to fund upgrades to their rigs, the general trend for hash rate is steadily increasing.
Building Bitcoin’s Macro Blueprint
Combining these variables (M2, hash rate, S&P 500, and gold) yields a robust multivariate regression explaining Bitcoin’s long-term trend. Gold, however, contributes little incremental value and was therefore excluded from the final model.
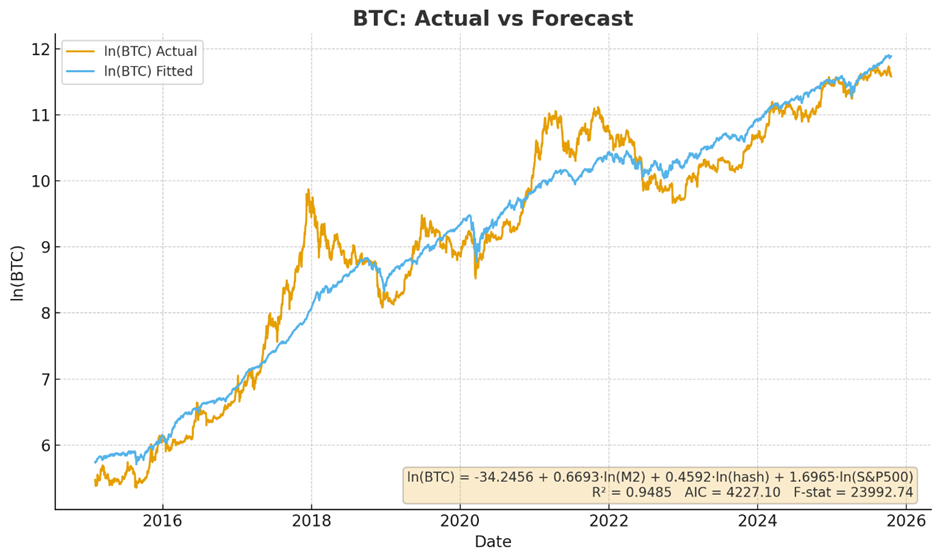
The PMI Amplifier: Turning Up the Bitcoin Cycle
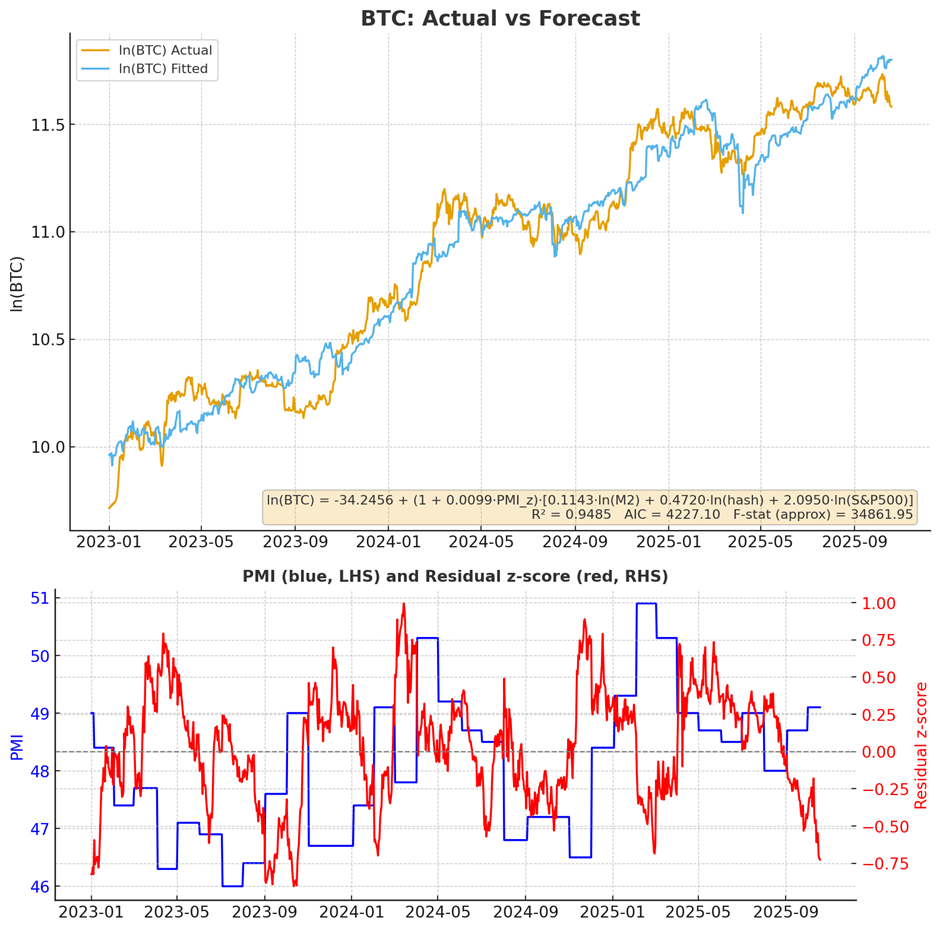
This baseline regression captures the broad structure of Bitcoin’s growth, yet it misses the amplitude of the major bubbles and busts. To fix that, we introduced PMI as a macro amplifier — scaling the combined influence of liquidity and risk variables.
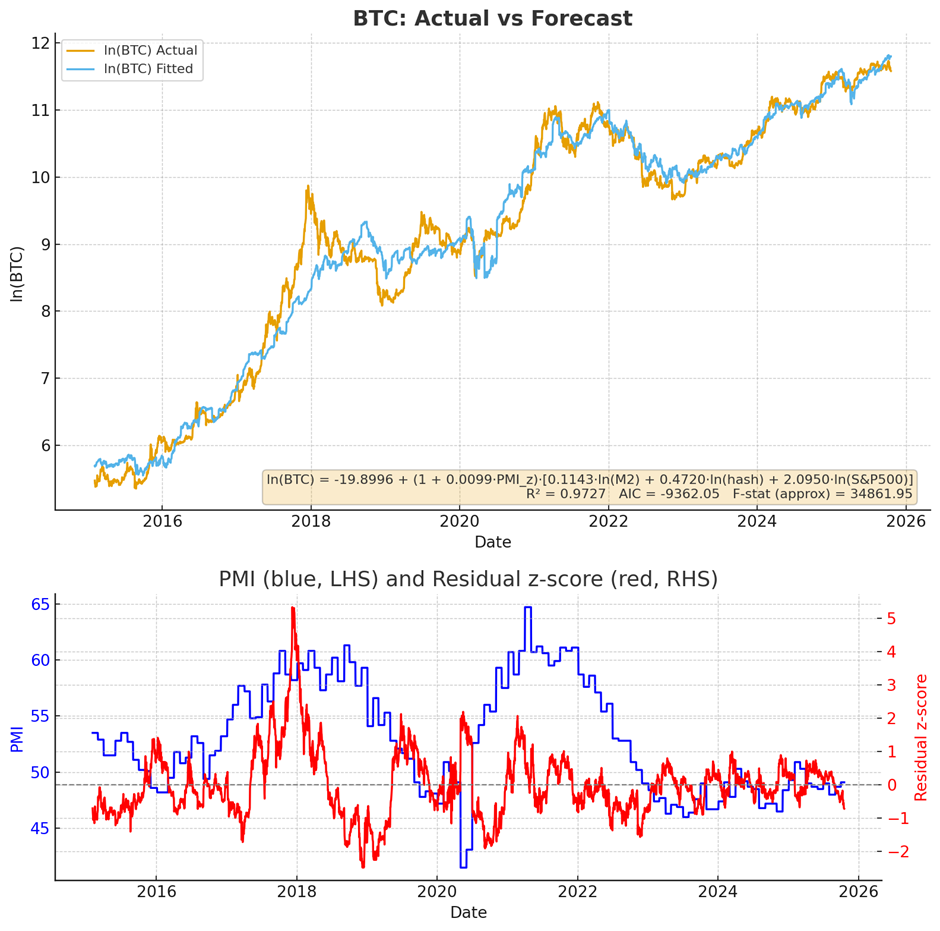
Mathematically, the regression equation looks like this:
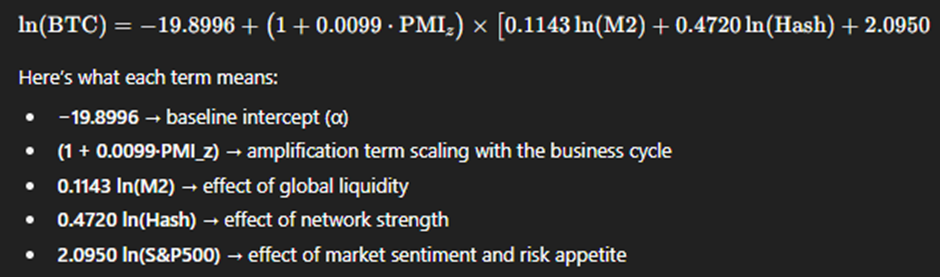
The addition of the PMI dramatically improves the model fit, especially during the euphoric peaks of 2017 and 2021. The enhanced model even tracks the 2021 double top with surprising precision.
Based on this analysis, it seems unlikely we’ll experience another FOMO blowoff top without a peak in the PMI business cycle first. And fascinatingly, since 2023, Bitcoin has followed the forecast BTC trend quite closely, with much smaller oscillations. The PMI shows us that the market has been in contraction mode for three years, with much smaller swings in Bitcoin.
What the Data Really Shows
· Cycle alignment: While many things align with Bitcoin’s price movements, major Bitcoin peaks and troughs have historically coincided with the PMI.
· Current fair value: Based on this latest regression, Bitcoin’s implied fair value is around $146 K — roughly 36 % above current prices.
· PMI below 50: The U.S. manufacturing sector remains in mild contraction. As PMI rises toward 50+, Bitcoin historically strengthens. The current US government’s drive to lower rates and reshore industrial manufacturing could drive a new long-term rise in PMI.
The Road Ahead for Bitcoin and the Business Cycle
If upcoming U.S. policies — such as renewed tariffs, industrial stimulus, or lowering interest rates — succeed in re-accelerating manufacturing, the PMI should climb.
In that case, Bitcoin’s cyclical amplification could return, setting the stage for the next major rally.
Conversely, if PMI continues to stall below 50, Bitcoin’s upside may stay muted until the business cycle turns decisively upward.
However, given that there has been no peak in the industrial cycle with exuberant leverage, we’re probably unlikely to see a bitcoin bear market that aligns with the bitcoin halving cycle.
The Bottom Line
· Bitcoin’s long-term trend is shaped by liquidity (M2), productivity (hash rate), and market sentiment (S&P 500).
· The PMI acts as an amplifier that explains the emotional highs and fearful lows of each cycle.
· The model suggests Bitcoin won’t see another blow-off top until the business cycle peaks again.
In short: Bitcoin doesn’t just follow halvings — it dances to the rhythm of the business cycle, which is far from overheated!
Bitcoin’s next big move won’t be decided by miners or memes — it’ll be written in the rhythm of the global factory floor.