The Half-Life of Bitcoin Treasury Companies

“It’s going up forever, Laura.” Michael Saylor
While this might be true for Bitcoin, Bitcoin treasury companies are different. They’re not Bitcoin.
Investors pay a premium for companies that can stack the fastest.
“It’s going up forever, Laura.” Michael Saylor
While this might be true for Bitcoin, Bitcoin treasury companies are different. They’re not Bitcoin.
Investors pay a premium for companies that can stack the fastest.
But as soon as their rate of stacking starts to slow, the mNAV (multiple of net asset value) premium implodes.
Poof! It’s gone.
If you happened to FOMO in at the top with a high mNAV, you’ve got a LOT of downside risk exposure.
As you’ll learn in this article, the faster it comes, the faster it will go.
The TL;DR:
· BTC-TCs that grow fastest early often burn out first.
· Logistic regression helps forecast BTC stack size and when BTC Yield will slow.
· Declining BTC Yield = falling mNAV = share price risk.
· Watch the half-life — it’s the tipping point.
From FOMO to Fundamentals: My BTC-TC Wake-Up Call
Like many others, I fell down the BTC-TC rabbit hole back in October last year, thanks to MSTR True North.
What MSTR was doing to raise capital and stack more Bitcoin faster and faster was fascinating. Back then, it looked like MSTR’s mNAV was going up forever.
Unfortunately, I was wrong. We can't just draw an exponential trend line through anything, willy-nilly!
Nine months later, my investment in MSTR is now finally in the green after holding on! The opportunity cost of holding onto Strategy while the share price went nowhere and mNAV impoded over the past 9 months is huge!
So what happened?
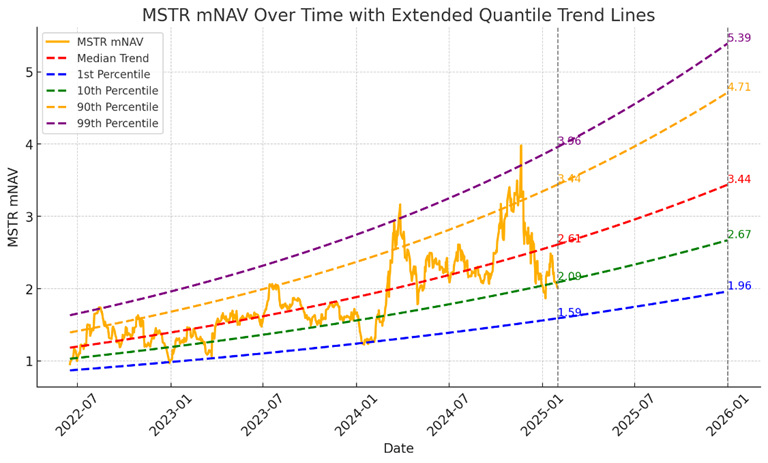
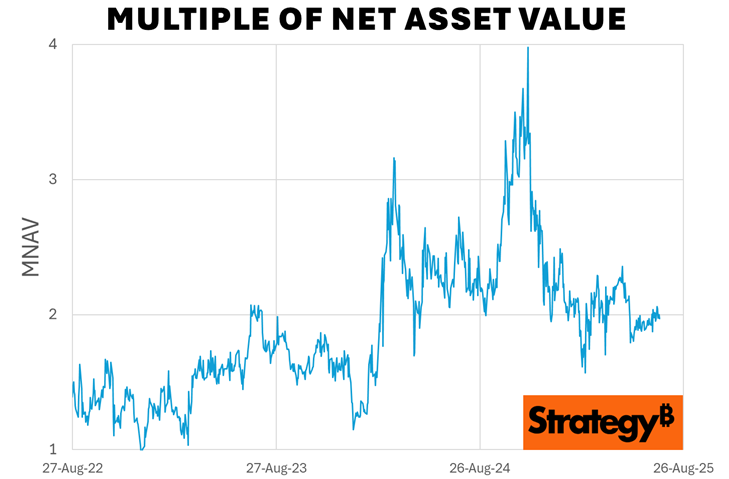
I now understand that Strategy pumped their BTC Yield with the ATM and convertible bonds before the election to levels they couldn’t sustain long term.
And when the BTC Yield (new BTC added divided by current BTC stack) slowed, the mNAV “tanked” from 4 to a low of 1.6.
After experiencing this, I’ve been super eager to understand it to make sure I don’t get burned again like that. But perhaps more importantly, I don’t want people reading my musings and analysis to get burned by excess hopium.
I wish someone had told me what I will unpack below, so I could understand how to manage risk when investing in BTC-TCs, especially when the typical mNAV today is much higher, leaving much more downside risk!
Mice, Whales, and Bitcoin Companies: A Survival Story
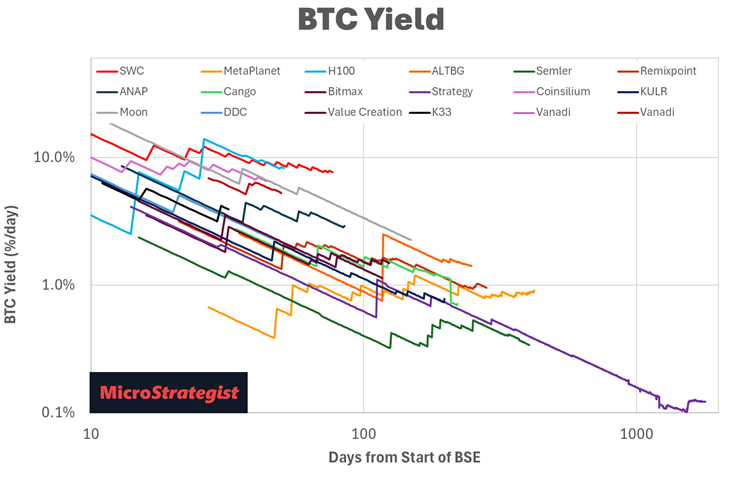
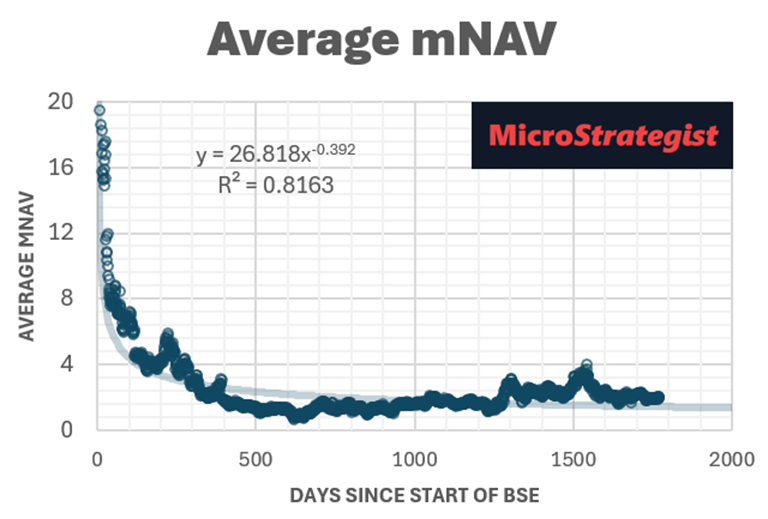
Since then, I’ve learned that, while Bitcoin tends to grow in line with a power law trend, mNAV premium and BTC Yield tend to decline in line with the power law
Note: “Power law” just means the trend becomes linear when plotted on a log-log chart.
Baby bitcoin companies can grow super quickly, but as they reach maturity, their growth slows.
A mouse grows to adulthood in just six weeks and may live 1-2 years, while a blue whale takes 10 years to grow to adulthood and can live for more than 90 years. The same principle appears to be true for BTC-TCs.

And just because an embryonic BTC-TC is injected with steroids (i.e. loads of early investment from venture capital funds), it won’t necessarily become the biggest fish in the sea. In fact, it may stunt its long-term growth.
As you’ll see, companies that grow the quickest are more likely to burn out early before reaching maturity. Once their growth stalls, mNAV will drop, and they will likely be eaten by the sharks and the whales who made it through this early stage.
I fear that many retail investors could be FOMOing in at the top, high on hopium and groupthink, believing their favourite BTC-TC will continue to go up like a rocket, only to become exit liquidity for the venture capital funds that bought in cheap at IPO.
Using Data to Spot the Peak Before the Fall?
Just like you try to predict how tall your child will be based on their early growth, by observing their growth trends, we can predict how big a BTC-TC might grow.
Lots of things in nature follow s-curve growth. We can only ever know the precise shape of the s-curve once it’s over, but we do know that a slowing of growth follows an initial exponential growth.
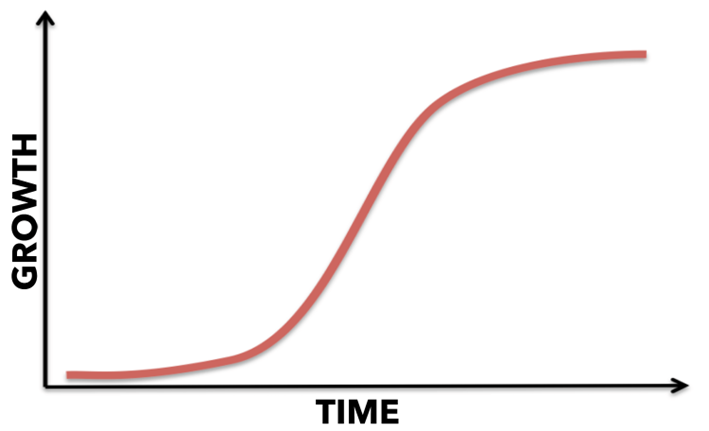
The halfway point where the growth starts to slow is the half-life.
The formula for modelling an S-curve is known as the logistic growth formula.
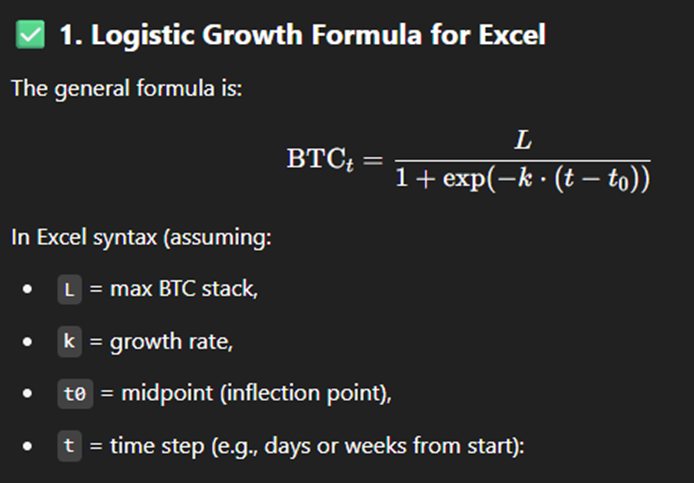
It can be fun to dream and model things with exponential projections. Unfortunately, no matter how much we believe and hope, exponential growth cannot continue indefinitely.
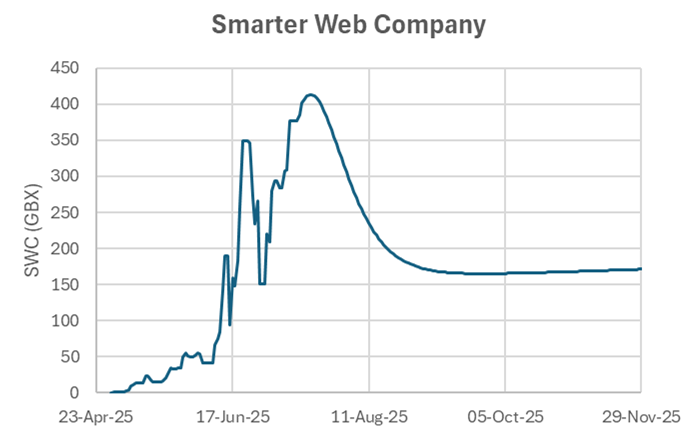
For example, the chart below shows that if the current exponential growth rate of 8.4% per day continues, SWC will own all 21 million BTC by 15 November 2025!
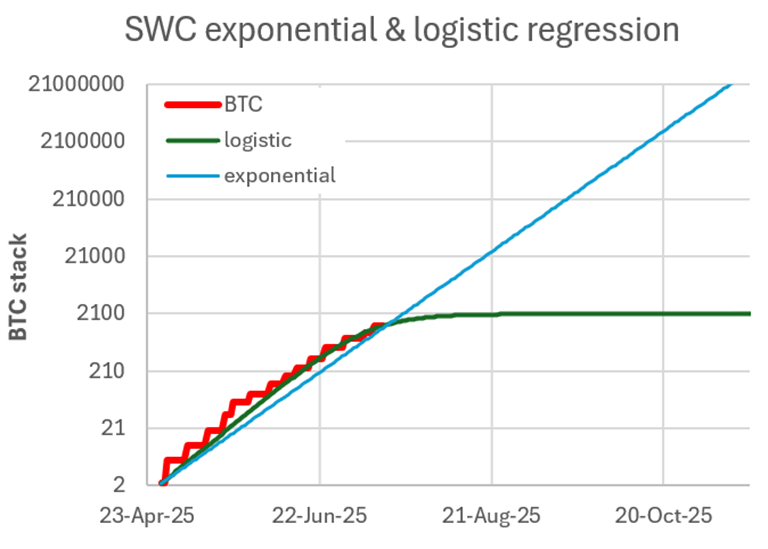
This is obviously nonsensical.
It has to slow down before then.
But when?
If we zoom in, we can see that the logistic curve (which has been optimised to maximise R2 with the data to date) is a better fit, particularly with the more recent data.
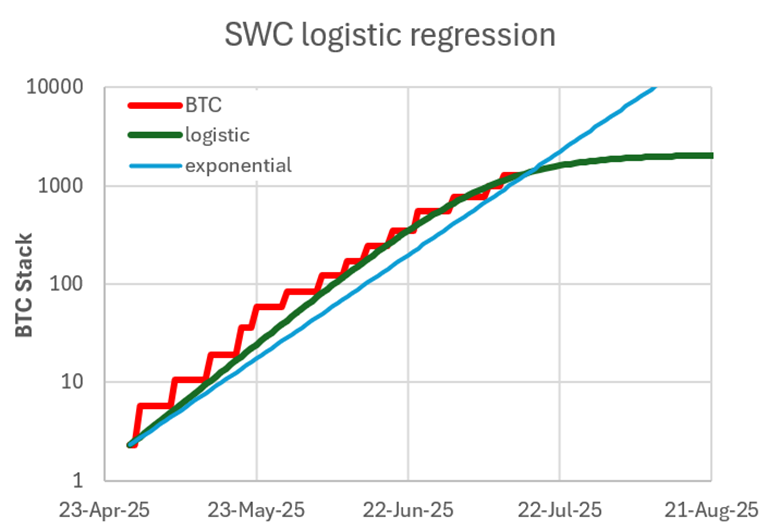
The regression analysis suggests that SWC will ultimately reach 1969 BTC, and their t0 (half life) is 73 days, meaning their growth rate started slowing on 9 July 2025.
This is obviously subject to change based on new data as it becomes available.
Forecasting mNAV Meltdowns Before They Happen
The dark blue line in the chart below shows the shape of the BTC growth rate predicted by the logistic regression.
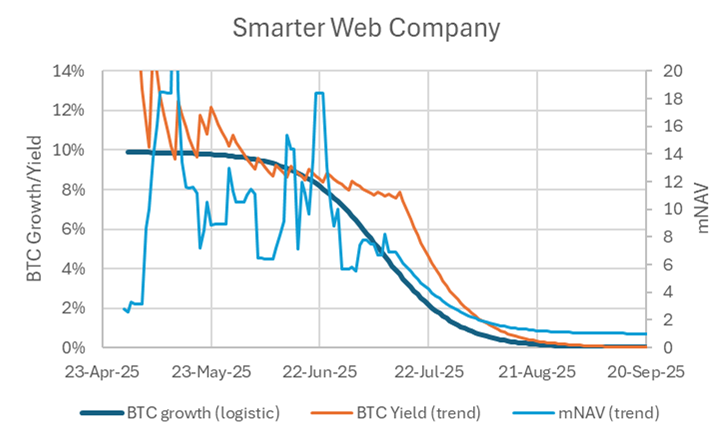
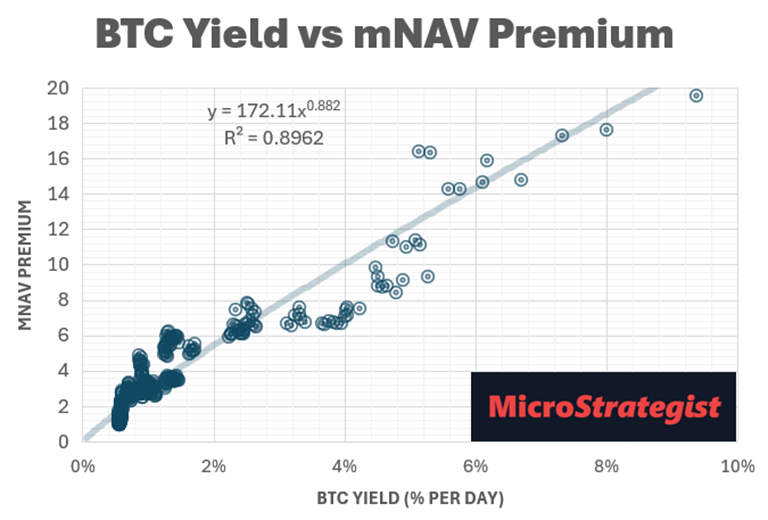
Remember, as a company’s BTC stack grows, the BTC Yield tends to decrease. And because investors pay a premium for BTC Yield, mNAV and thus price will drop as BTC Yield rolls over.
So, if we assume that BTC Yield decreases from its current value in line with the decrease in BTC growth, we can forecast where BTC yield might be headed. Additionally, we can also predict where mNAV might be headed (assuming mNAV = 1 when growth = 0).
Bringing all this together, we can forecast where the price of SWC might be if BTC continues to follow power law growth (i.e. about 30% p.a.). This bearish approach forecasts that SWC’s price will bottom out at 161 GBX in October before climbing slowly with BTC from there.
There are a lot of assumptions here, but understanding the relationship between BTC growth, BTC Yield and mNAV provides a more risk-averse scenario that can work as an antidote to the hopium and groupthink that abounds.
Could a surprise VC injection or ATM turbocharge reset the curve? Maybe, once the growth has departed from exponential, this only likely delays the inevitable.
It won't take long to find out if this model is useful or junk.
S-Curves, Slowdowns, and Survival of the Fittest
When we first started publishing the BTC Treasury Stacking Race chart, we got a few comments from astute observers that exponential projections were ridiculous. And they’re right. Eventually, growth has to slow, especially. There are only 21m BTC available!
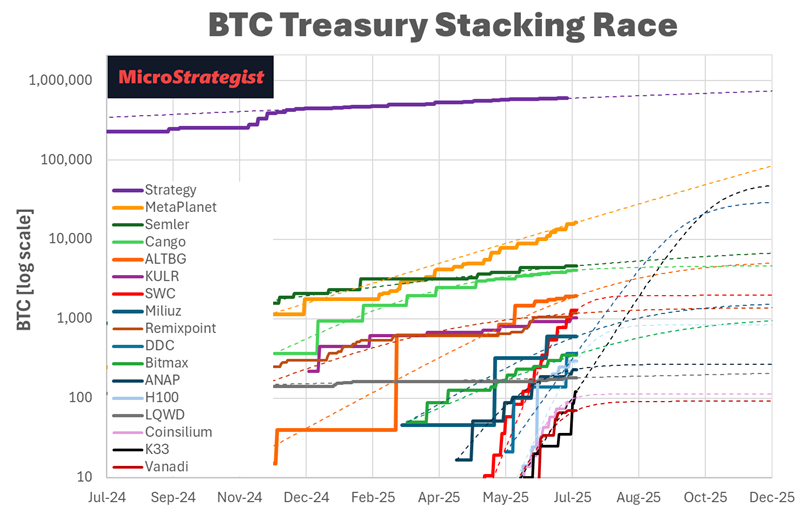
We’ve now added the logistic regression to the chart, highlighting which companies have dropped below exponential growth, giving some indication of how their stacking might slow going forward.
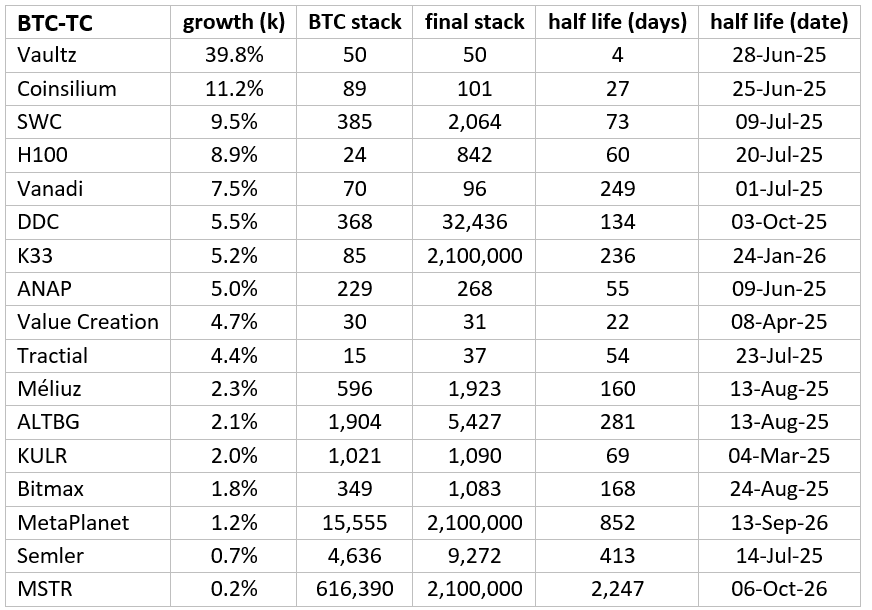
The table below shows the details of our analysis, showing:
· Logistic growth rate (k) (%/day),
· Current BTC stack,
· Final projected BTC stack,
· Half-life (days), and
· Half-life (date).
The chart below shows the relationship between the logistic growth rate and the half-life (in days). Fascinating, we see another power law, with the growth rate vs half life becoming linear when plotted in log-log space.
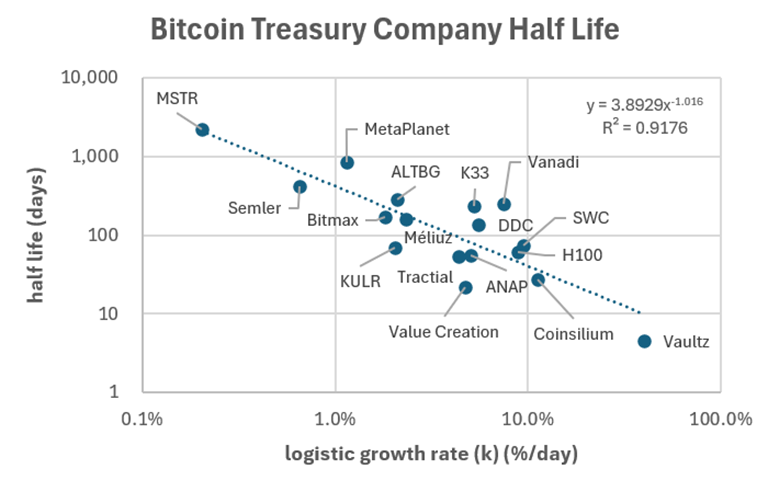
With limited BTC available, growth is likely to slow sooner if the launch trajectory is steeper. Conversely, it seems that BTC-TCs that grow more slowly can build a better foundation and continue to grow for longer. If they come out of the gate too fast, it becomes challenging to keep up with the exponential growth curve.
The chart below shows that smaller companies might be able to grow much faster initially and pay less for their BTC stack per coin, but if they can’t maintain the exponential pace, their final stack might not be as large.
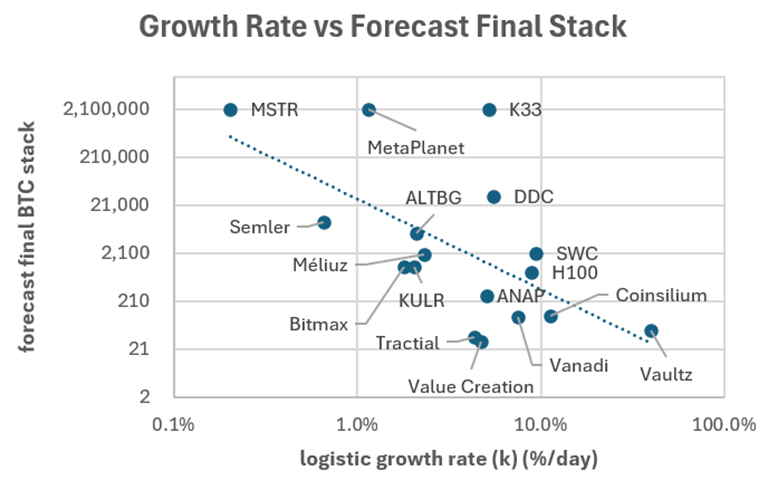
This is not to say that no one should buy smaller companies that are taking off like a rocket. Just be aware that it may be a short-term trade.
As soon as they start to depart from exponential growth, you might want to eject and rotate to the next fastest horse.
Meanwhile, if you’re more of a long-term investor who doesn’t want to be churning your portfolio, you might want to look for companies with a more conservative launch trajectory that might still be growing months and years from now.
Building Smarter Portfolios With Half-Life Data
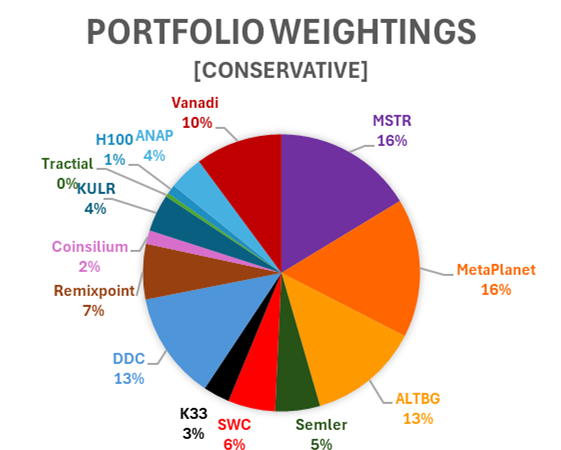
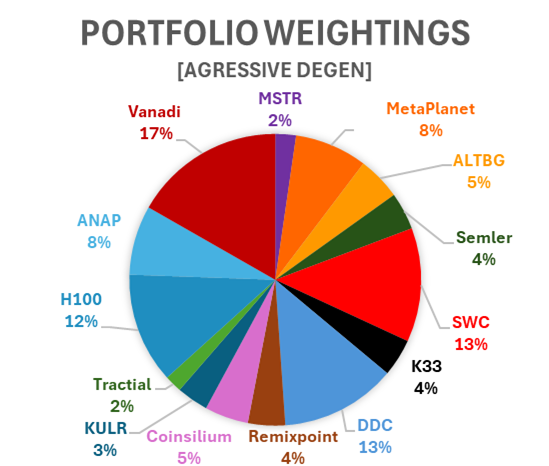
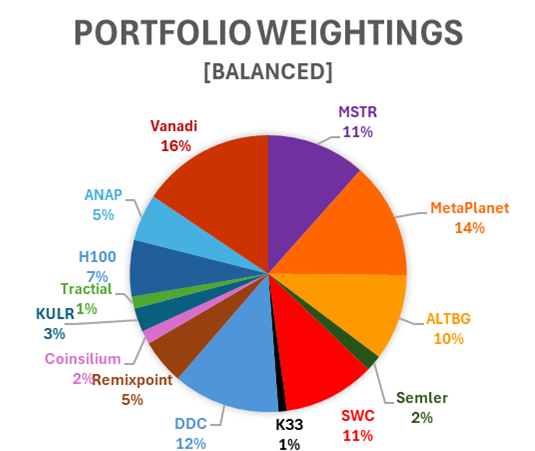
With a flood of BTC-TCs hitting the market, we’ve developed a systematic approach to portfolio allocation:
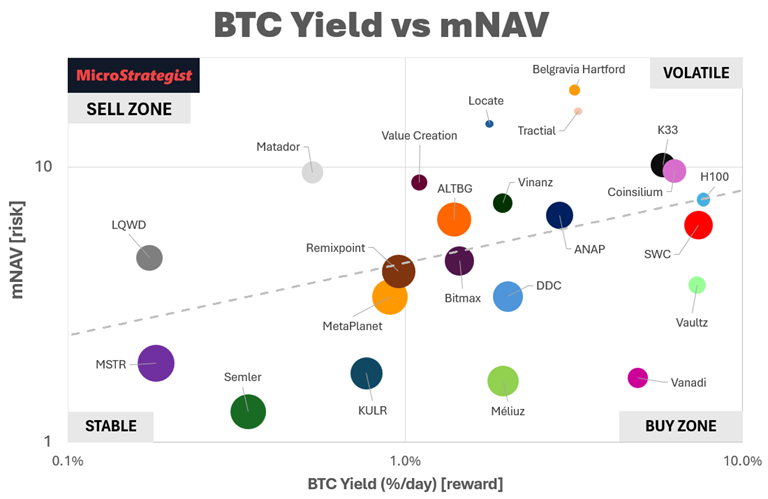
· Conservative: Minimise exposure to BTC-TCs with slowing growth and potential mNAV implosion.
· Aggressive Degen: Chase short-term gains in BTC-TCs with high BTC Yield and low mNAV.
· Balanced: Blend both for risk-managed upside.
By monitoring metrics like BTC Yield, growth rates, and half-life projections, we can identify the most promising reward-to-risk plays, tailored to your risk tolerance and time commitment.
Avoid Being Exit Liquidity for the Sharks
It’s tempting to believe every new BTC-TC is the next MetaPlanet or MSTR.
But exponential growth can’t last forever.
Understanding the half-life of BTC-TCs — and adjusting your portfolio accordingly — could be the difference between riding the next wave and being left holding the bag.