Halving Hype vs. Macro Reality: Why Bitcoin Is Set to Catch Up Fast

Every four years, the crypto world holds its breath for the next Bitcoin halving — a ritual countdown often credited with triggering explosive rallies followed by massive crashes.
But… this ‘cycle’ has been underwhelming, to say the least.
Even Uptoper has been renamed ‘Voltober’.
Many are wondering whether the four-year stock-to-flow model has finally broken.
The truth is, it was never the whole story to begin with.
By looking beyond halving hype and focusing instead on broader macroeconomic indicators — the US ISM PMI, gold, and small-cap equities — a clearer picture emerges.
Bitcoin’s bubbles and busts don’t follow the calendar or halvings; they follow the business cycle, which pushes price around the hash rate backbone.
And right now, Bitcoin is definitely lagging, with plenty of upside once the halving believers run out of coins to offload.
The Macro Story Behind Bitcoin’s Booms and Busts
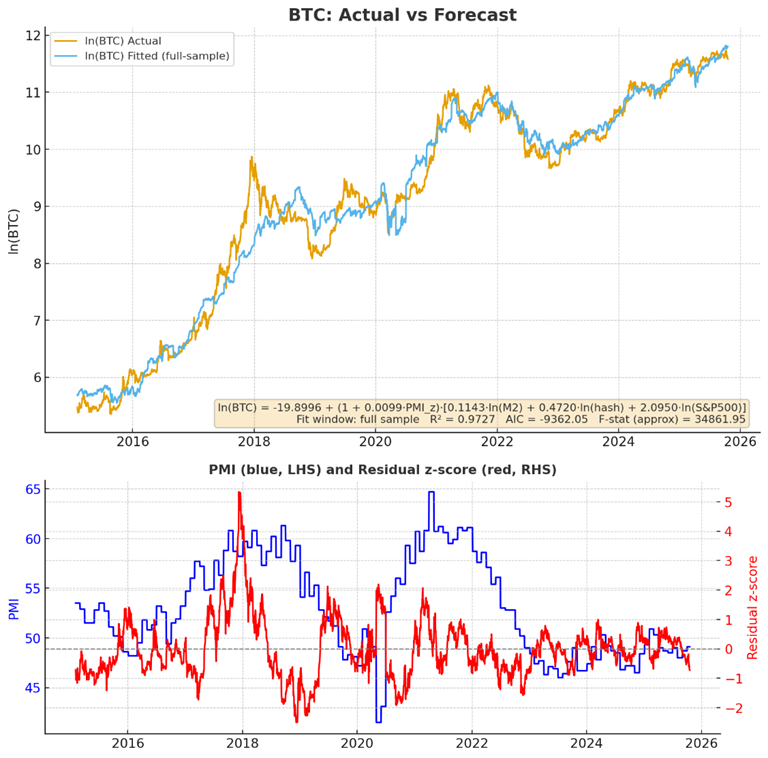
In our previous analysis, we explored how, rather than halvings or election cycles, Bitcoin’s volatility peaks align more closely with the business cycle, best modelled using the US ISM Purchasing Managers Index (PMI).
The PMI peaked in 2017 (Trump 1 pump) and 2021 (post-COVID stimulus), both coinciding with major Bitcoin tops and, coincidentally, post-halving. But since mid-2023, the PMI has been slowly grinding higher — just like Bitcoin’s price action.
Many early Bitcoin whales are likely trimming positions now, still anchored in their deeply ingrained belief in the four-year halving cycle. But today’s economic backdrop looks nothing like the euphoric peaks of 2017 or 2021. We’re in a different paradigm, with central banks still trying to rein in the post-COVID splurge.
In this article, we show you how we’ve further refined our fair-value macro model by incorporating additional factors such as gold and small-cap stocks, both of which move in step with the business cycle.
Halving Cycle Believers Are Weighing Bitcoin Down
Gold is surging as global investors embrace the “debasement trade” — rotating out of US Treasuries and into hard assets. Even JP Morgan is talking about the debasement trade, as they allow pivot to allow Bitcoin as collateral.
Bitcoin, by contrast, has been unusually flat since its post-election high of $108k in December 2024, even though macro conditions appear solid: liquidity is rising, rates may soon fall, and Trump’s reshoring push could further stimulate domestic growth.
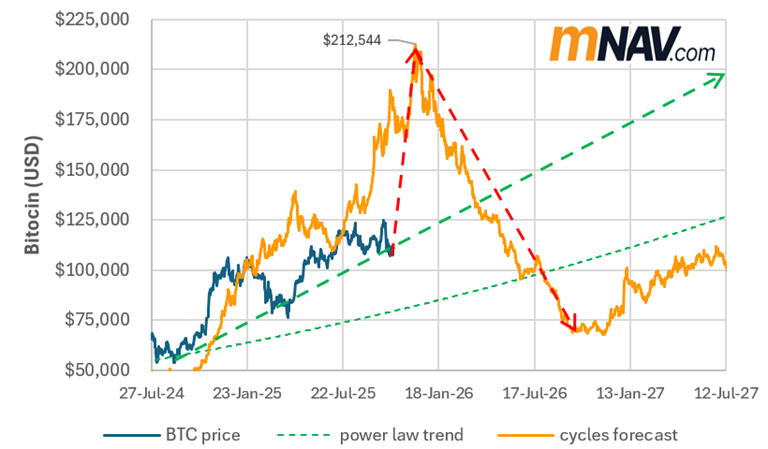
The chart below contrasts Bitcoin’s current price (blue) with a hypothetical repeat of past halving cycles (orange), projecting a peak in December 2025. For long-term holders steeped in the halving myth, de-risking late this year makes sense because they have long anticipated a blow-off top followed by a 2026 downturn.
As noted by James Check, Bitcoin OGs are taking a lot of profit right now, which sounds bad, but the good news is that many people are stepping in to buy, thus keeping the price from dropping further.
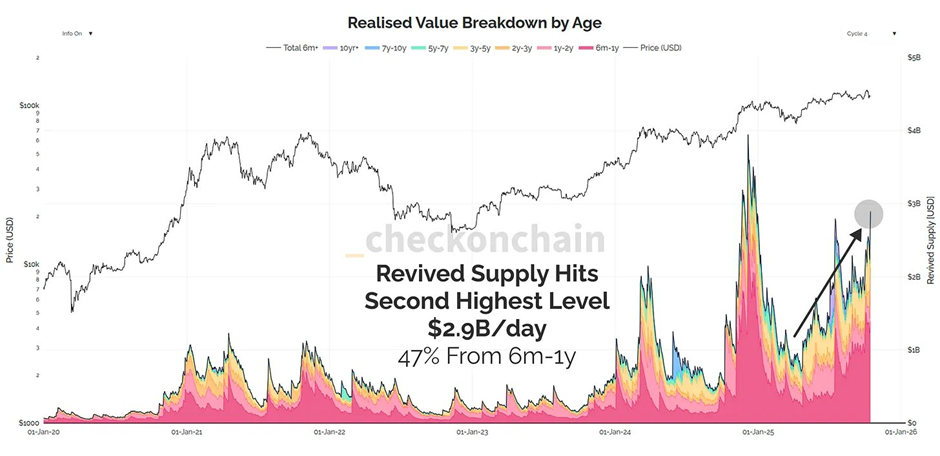
This wave of long-term selling, combined with a sluggish business cycle, helps explain Bitcoin’s current lethargy.
Yet if the real driver is macro, not halvings, Bitcoin could catch up rapidly once this selling pressure and downside volatility fades — especially if US interest rates decline and the economy starts to fire up.
Gold, Small Caps, and the Business Cycle — The Missing Links
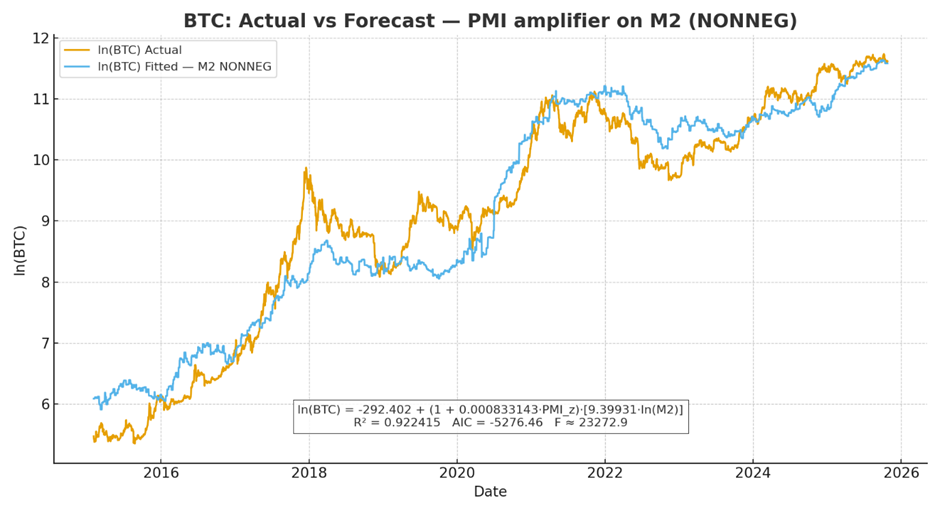
Our prior model identified M2, hash rate, and the S&P 500 as core inputs, with PMI acting as an amplifier that enables us to mode leverage and FOMO during expansions.
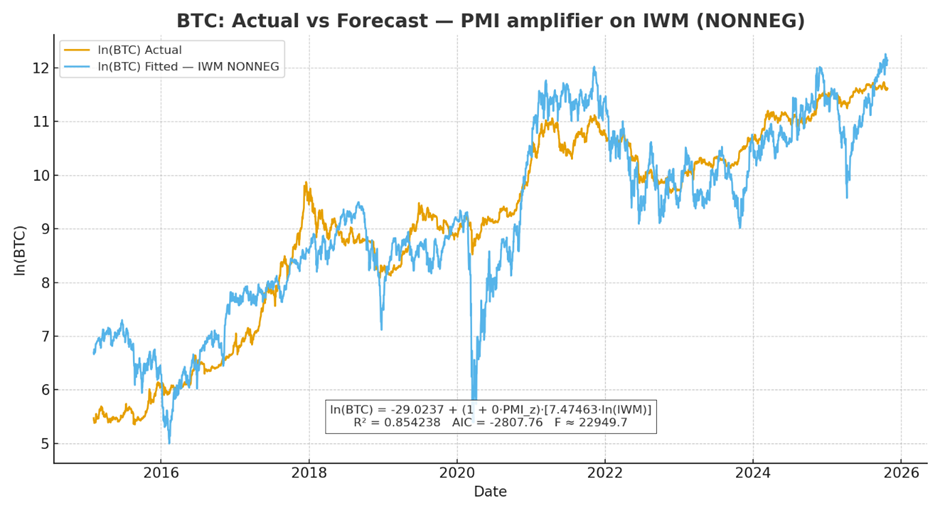
More recently, Dan Hillery noted a strong correlation between Bitcoin and the iShares Russell 2000 ETF (IWM) — a proxy for small-cap equities and risk appetite. Unlike the monthly PMI, IWM provides daily resolution into investor sentiment and small-business risk exposure, which moves much more quickly than the S&P500.
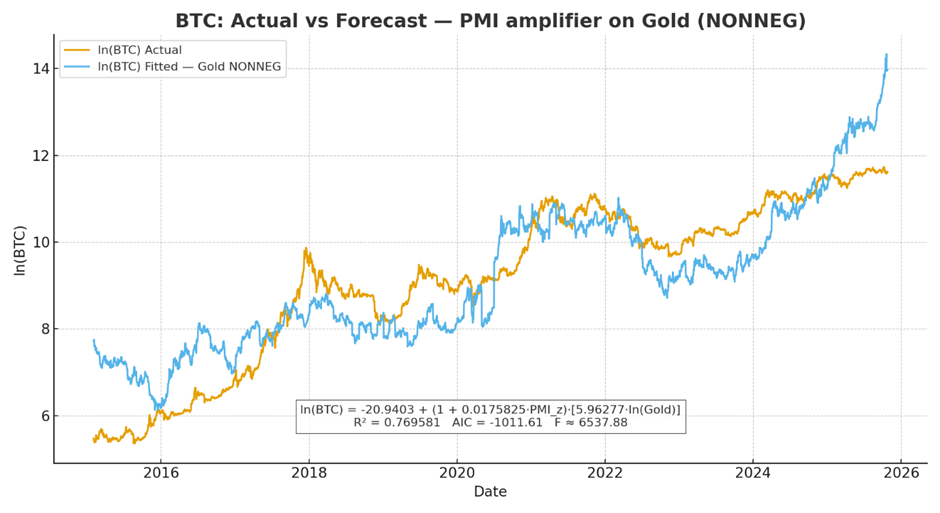
Then there’s gold, the elephant in the room. Since late 2022, BRICS nations — including China, Russia, and India — have been divesting from Treasuries and strengthening trade relationships backed by gold.
Many have noted that Bitcoin often trails gold’s moves, implying a potential catch-up phase ahead. While the US tilts toward digital assets and stablecoins, the East’s pivot to gold underscores a world split between two forms of hard money.
As global banks back away from US Treasuries, we could be headed toward a multipolar world. Maybe gold runs first, with Bitcoin set to follow once we safely navigate the traditional halving bubble danger zone?
Only time will tell, but the data will continue to offer clues.
Single-Factor Insights: Liquidity, Stocks, and Digital Gold
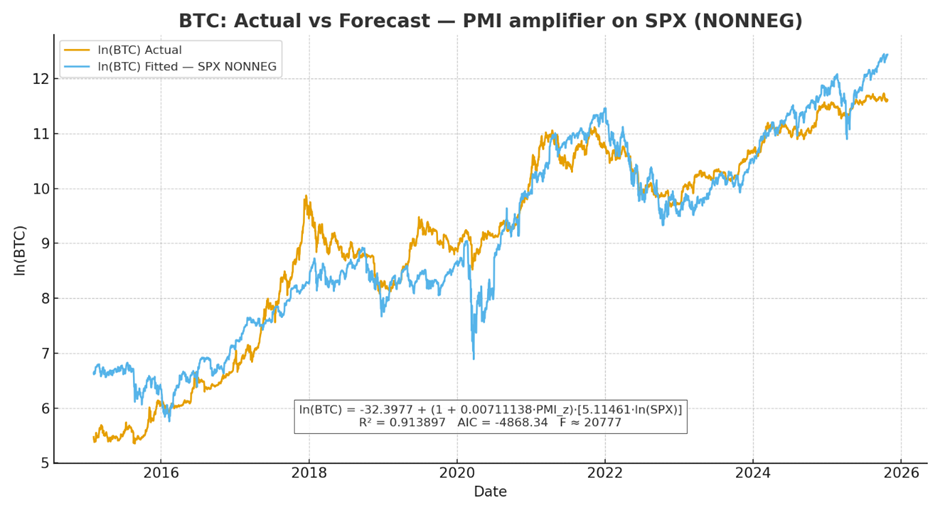
Listed below are the single-factor regressions (each amplified by the PMI) that form a component of our composite macro model:
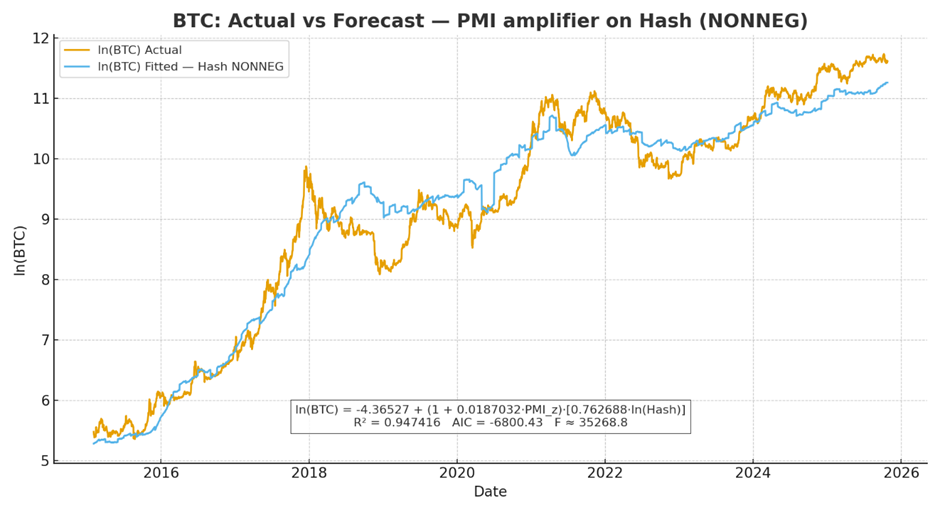
1. Hash rate remains the strongest predictor of Bitcoin’s price — as the network becomes stronger, more people are willing to trust it with their money.
2. M2 ranks second, aligning with Bitcoin’s behaviour as a liquidity sponge.
3. The S&P 500 follows.
4. Then the iShares Russell 2000 ETF (IWM), which exhibits more volatility, reacts much more quickly to swings in the business cycle than the PMI.
5. Lately, despite its nickname “digital gold,” Bitcoin has yet to move in lockstep with it. And as you’ve probably heard, it’s been running hard since mid-2022.
Combining Signals for a Clearer Fair Value
Each of these factors has limited use, but when combined, these variables create a more comprehensive multivariate regression. Our combined model uses hash rate, S&P 500, IWM, and gold (note: M2 was dropped to collinearity, meaning it didn’t add any extra value once all the other factors were incorporated).
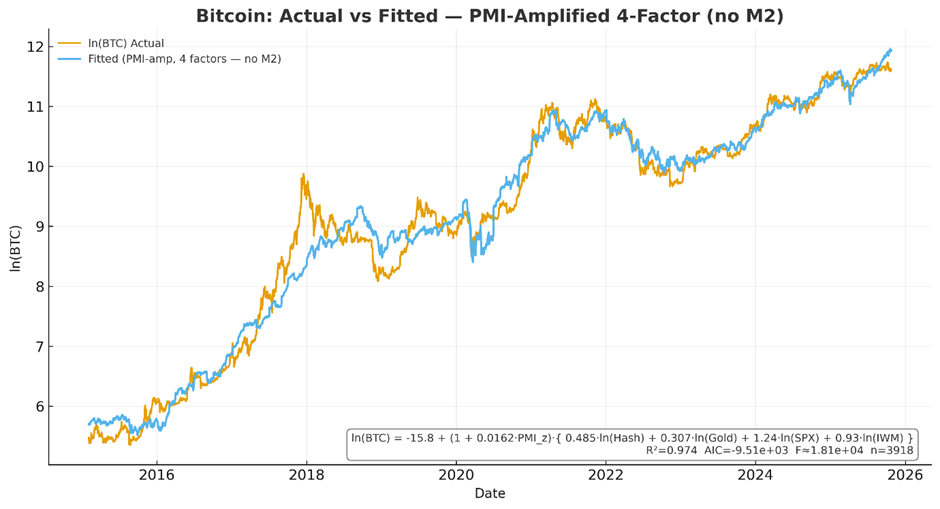
While hash rate remains the dominant factor, the S&P 500, small-cap stocks, and gold refine their fair-value estimates to reflect changing macro conditions. Together, they form a dynamic model of Bitcoin’s long-term equilibrium — its ‘macro fair value’ — that tracks the boom-and-bust business cycles really nicely.
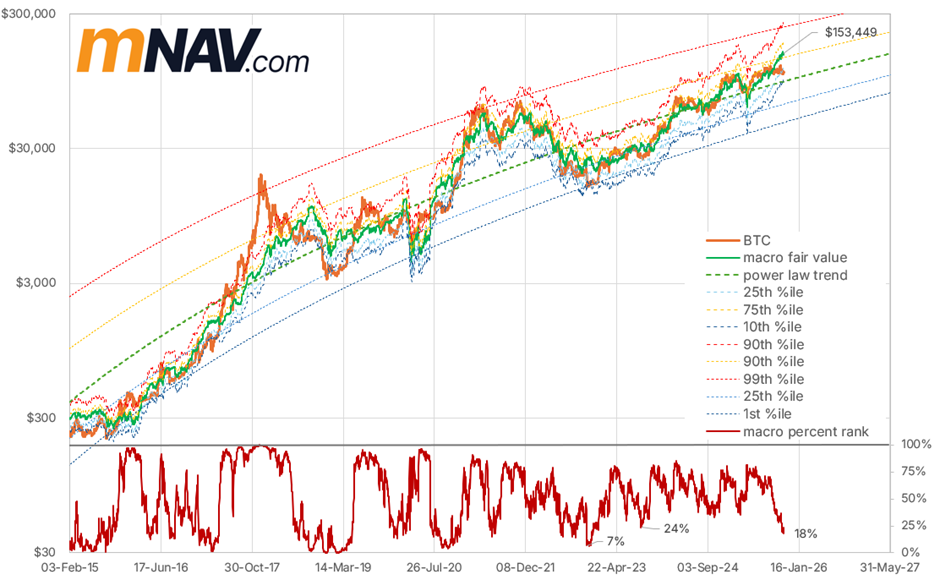
Decoding the Signals: Power Laws and Probabilities
To make sense of this data, the chart below includes:
· A macro %-rank oscillator (showing Bitcoin’s current deviation from the macro fair value),
· The power-law trend and quantiles, and
· The percentile range of fair value based on historical norms.
The power law makes exponential growth appear linear on a log-log chart, but it’s no predestined prophecy. Like any good model, it adapts as the data unfolds.
While we can project the power law forward to understand where Bitcoin might be headed — hash rate, equities, and gold — explain why Bitcoin oscillates within these quantile bands.
It seems the spring is loading, thanks in part to cycle believers unloading. Currently, our macro oscillator sits below the 2023 pre-ETF-launch lows but above the 2022 post-FTX bottom.
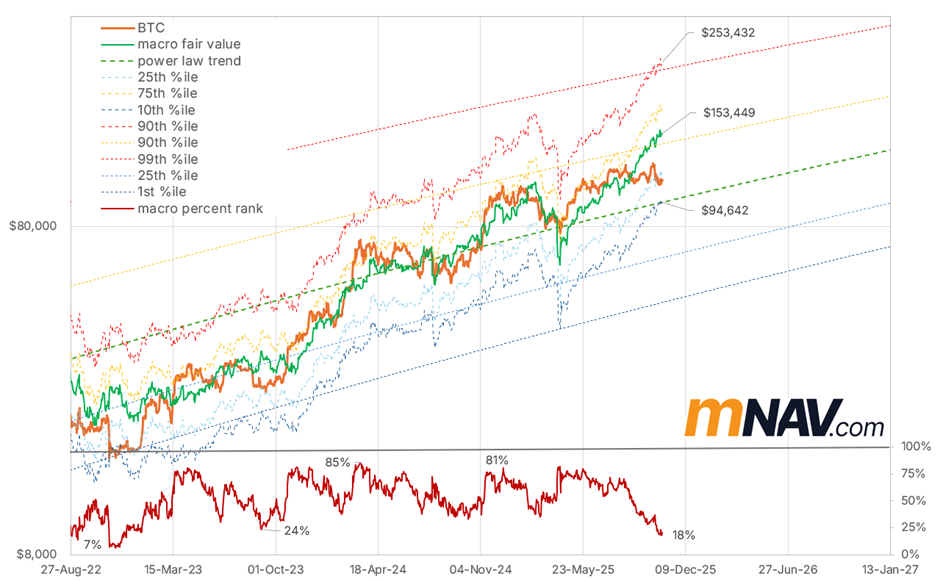
It’s no wonder so many are getting a bit anxious as they wait for Bitcoin to make its next move. The fair-value model implies Bitcoin should be around 50 % higher (~$153k).
A FOMO-driven move to the 90th percentile could push prices toward $260k (close to the power law 99th percentile quantile line), while extreme bearish sentiment might test the $95k floor for this fair value range.
These projections aren’t certainties but probabilistic outcomes guided by macro context.
Given the current macro environment, Bitcoin doesn’t belong at the bottom of the power-law quantile range.
So… Where Do We Go From Here?
Predicting the future is impossible, but understanding where we are in the cycle helps frame probabilities.
· Long-term holders and halving believers are trimming exposure, holding the beach ball underwater.
· Gold’s surge shows capital rotating away from the US dollar toward hard assets.
· Bitcoin remains deeply discounted relative to its macro fair value, at levels not seen in three years.
As the next wave of liquidity arrives, rates lower, quantitative tightening ends, profits from gold rotate, and renewed risk appetite could flow into Bitcoin, setting the stage for an accelerated catch-up.
When the Halving Hype Ends, the Real Cycle Begins
· The data suggests Bitcoin’s rhythm is governed not by the halving clock, but by the business cycle.
· The four-year halving narrative still shapes psychology, likely keeping the bitcoin price suppressed, while macro fundamentals tell a different story.
· While the PMI is trending slowly upward, it’s far from the peaks that drove the previous bubbles, so a crash is unlikely. In fact, a lot of leverage has just been cleared from the system.
· With gold breaking records, liquidity poised to expand as rates ease, and the US working hard to bring back manufacturing, Bitcoin appears undervalued relative to its long-term macro fair value.
· As halving-cycle believing sellers become exhausted and macro tailwinds further strengthen, Bitcoin is positioned to catch up to its macro fair value — whether through a steady climb or a sharp repricing — as confidence and capital return to risk assets.