S-Curves and Sats: Decoding the Future of Bitcoin Treasury Growth

Lately, I’ve been laser-focused on one thing: understanding the future growth of Bitcoin Treasury Companies (BTC-TCs).
My initial piece — The Half-Life of Bitcoin Treasury Companies — received plenty of ‘constructive’ feedback. But, ironically, since then, we've seen significant mNAV compression, with many BTC-TCs pulling back by over 50%.
Stacking gets harder when prices fall. ATMs become less accretive, and investor confidence erodes. Ultimately, not every BTC-TC wins. Only the strong (and smart) will survive because they can continue growing their BTC stack even through the hard times.
That’s why I believe modelling the shape of a company’s BTC accumulation curve is critical. It helps us determine whether a company is losing momentum or just getting started — and what that might mean for its future price action.
It’s not just for investors. BTC-TCs themselves can use this framework to manage growth more intelligently, stack more effectively, and navigate volatility with foresight.
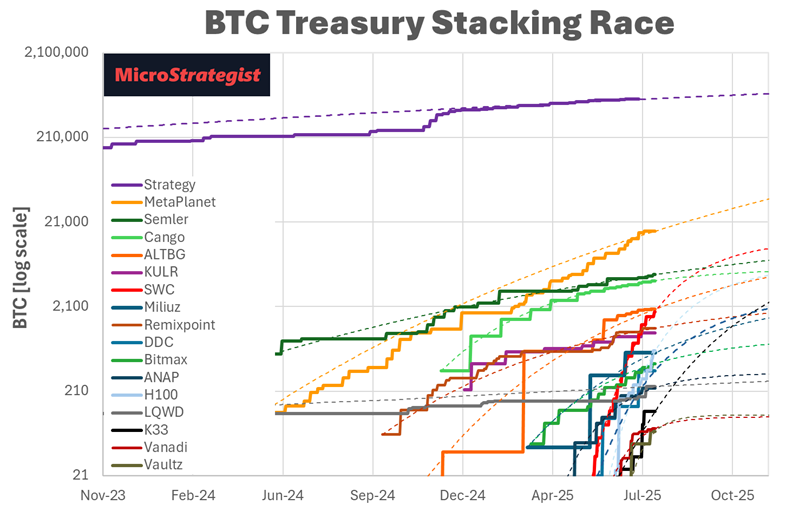
Recapping the Stacking Story: S-Curves and Reality
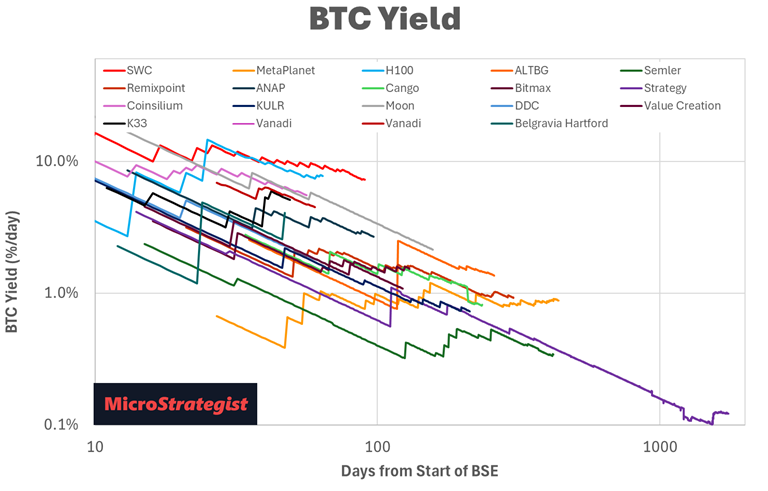
Here’s a look at actual BTC stacking data with the generalised Gompertz regression (a more gentle model than the more aggressive logistic regression).
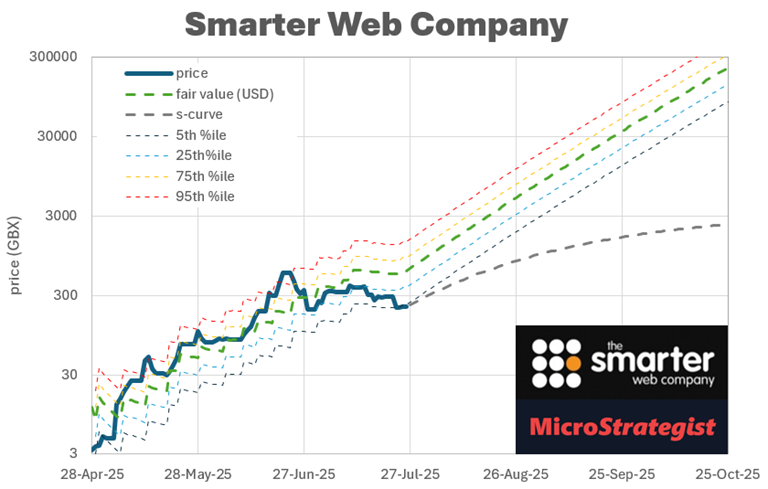
Let’s double-click on The Smarter Web Company: Their stacking follows a predictable growth pattern, with regular buy announcements, so investors can understand how the strategy is unfolding. The regression shows an R² of 0.986 — extremely high correlation.
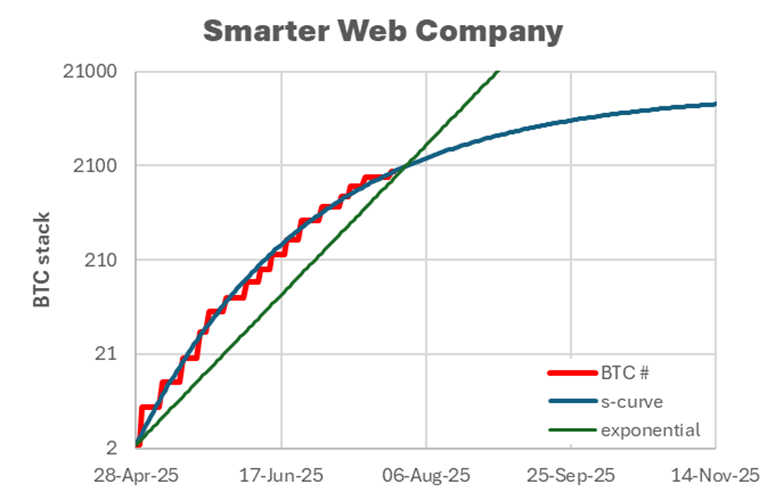
Some might see the log-scale chart as bearish. But on a linear scale, the trend is more reassuring.
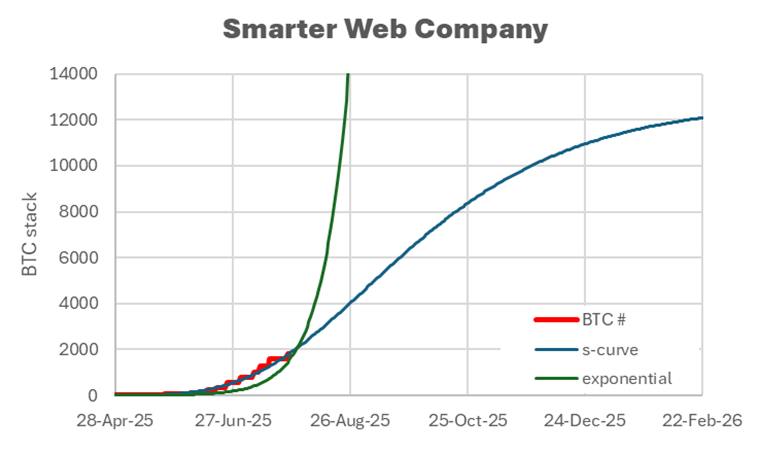
It’s tempting to project continued exponential growth, but with just 21 million BTC to go around, all stacking curves must slow eventually.
For SWC, our regression suggests an ultimate stack of ~12,800 BTC by late 2026 — a projection that we’ll refine as new data becomes available. A few recent solid BTC buys and a significant pullback in price now makes SWC look very attractive!
Forecasting Price Scenarios
These models don’t just help us understand stacking — they allow us to simulate bearish scenarios for each BTC-TC. The grey dotted line on the charts represents conservative price forecasts based on the stacking trajectory, while the more bullish fair value model is based on their current BTC Yield.
Using this approach, we can then rank BTC-TCs based on their near-term upside or downside potential.
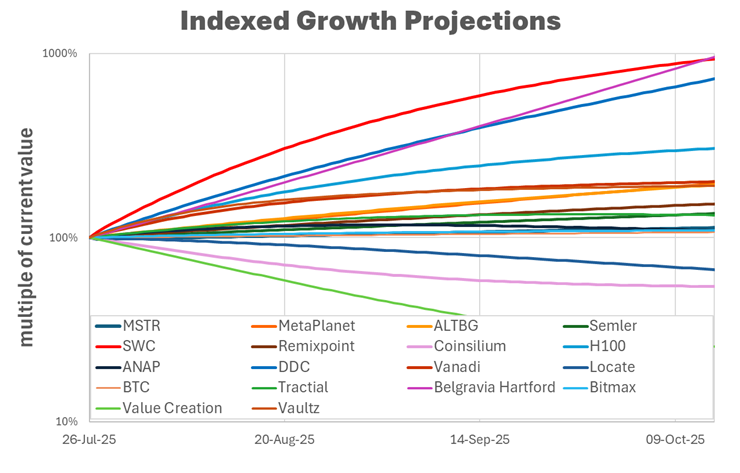
Based on recent trends, SWC is one of the most promising candidates over the next three months, followed by Belgravia Hartford, DDC and H100.
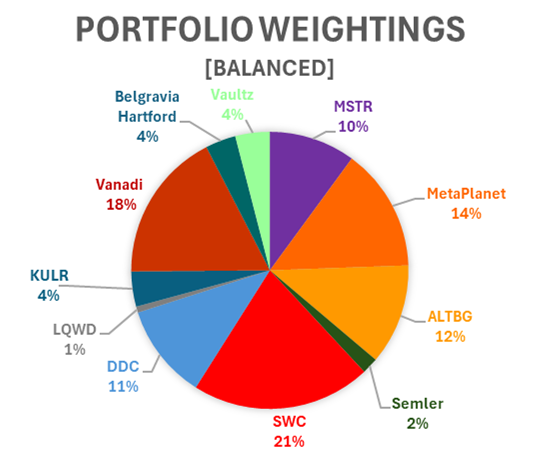
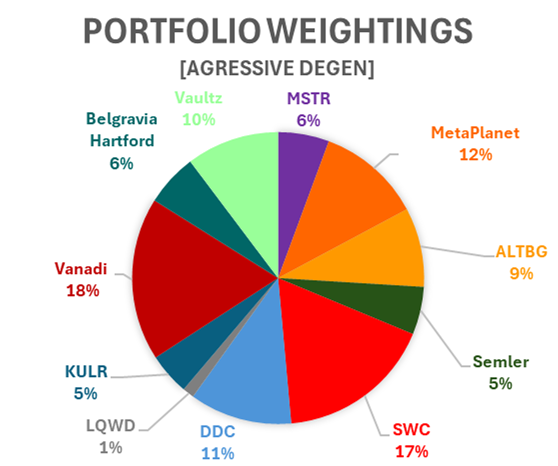
Allocating Smarter with Confidence
These projections also shape portfolio construction:
· The aggressive portfolio leans on optimistic “fair value” projections, while
· The conservative portfolios stick closer to the regression-based “likely max” values.
· Companies that appear likely to slow in the near term and see massive mNAV compression don’t make it into any of the portfolios.
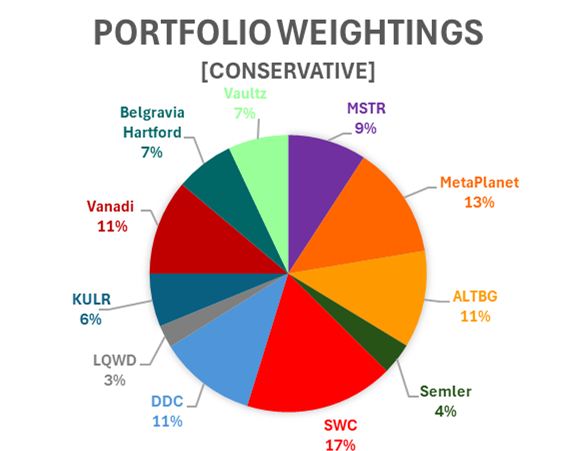
This is not about picking winners on hype — it’s about backing consistent, compounding execution.
Inside the Growth Models: Comparing BTC-TCs
Below is a comparison of BTC-TCs using our regression model parameters:
· k = growth rate
· v = shape factor (steepness and symmetry)
· half-life = time to reach mid-point where growth slows
· inflection date = when growth starts to slow
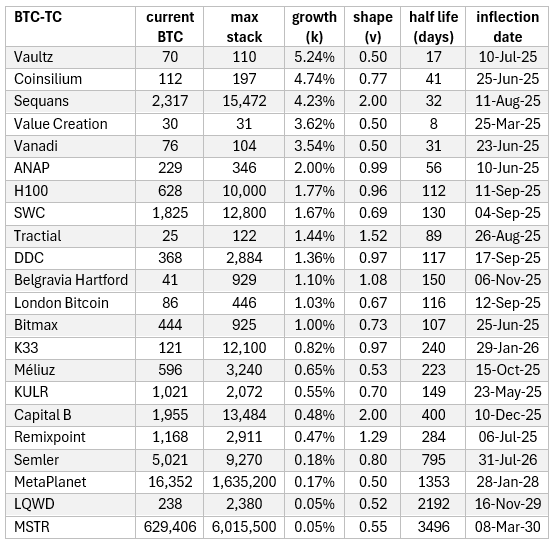
For the quant nerds:
· The growth rate (k) governs how quickly the company grows its BTC stack.
· The shape factor (v) governs the steepness and symmetry of the curve. V < 1 means we see a gentler rise, while v > 1 means a sharper early rise and steeper curve.
If you’re a BTC-TC CEO or Head of Bitcoin Strategy, you can use these parameters to plan your purchases and funding similar to your favourite company.
Why This Matters: Insights for Investors and Executives
In general, companies that stack rapidly early on hit the wall sooner. If they’re growing fast and exponentially, they’re on a collision course for the 21m ceiling sooner, so there’s much less room for error or glitches.
The models aren’t perfect — they’re a snapshot — but they give us early warning signs when mNAV might be about to collapse.
The more consistent stackers? They’re likely to still be buying in a year or two. The hard-and-fast starters? Maybe. Maybe not. Smaller, faster companies growing more quickly have more potential for reward, but also risk if their stacking slows.
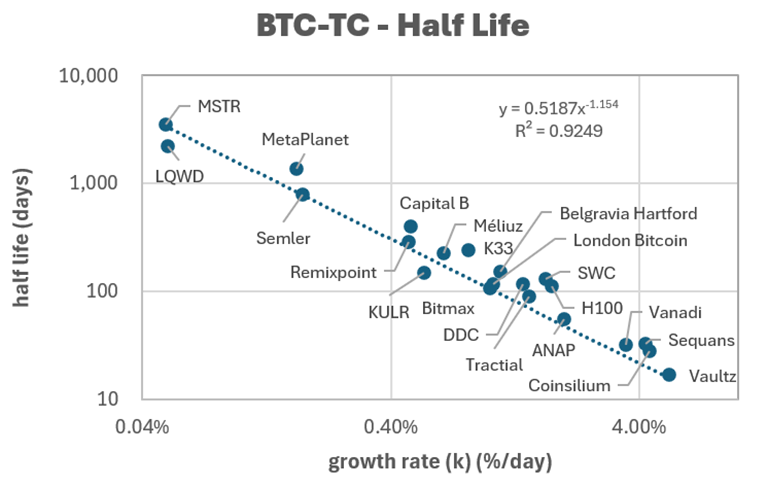
The data suggests that companies growing more slowly might end up with a larger stack in the long term. But the correlation here is much lower.
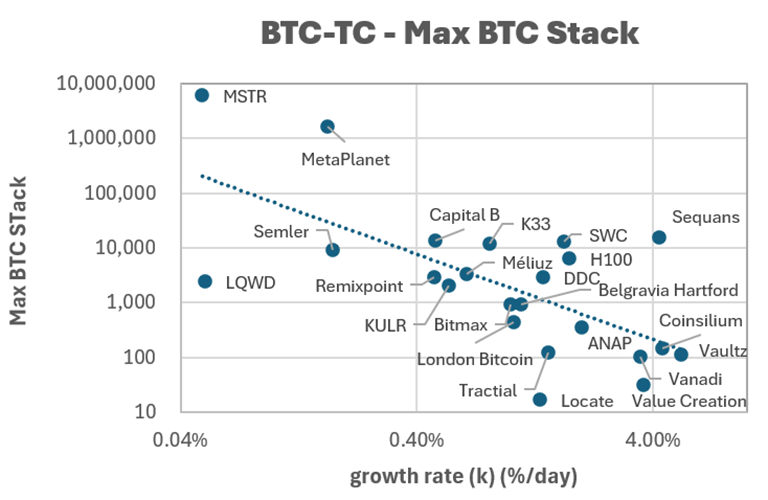
And keep in mind that I’ve set a maximum of 10 x their current stack; if they continue to grow consistently, their max stack forecast may continue to rise.
Final Thoughts: Stacking Is the Signal
Yes, this analysis is nerdy. But if you’re serious about BTC-TC investing or strategy, this is the signal — not the noise.
Demonstrating consistent stacking and sustainable BTC Yield is the #1 KPI for any BTC-TC.
When stacking slows? mNAV collapses. Fast.
But fear not, you don’t have to run all this tedious analysis. We’ll continue to do it and share the resultant portfolio, continually balanced with our subscribers.
Nothing’s certain, but the data gives us some insight to guide our next steps.
Join the Conversation
What do you think about these projections?
Drop a comment below and let me know which BTC-TC you think is flying under the radar — or about to hit the wall.