The Great Bitcoin Reset: Pain, Purge, and Setup for the Next Rip?

After the two-day “Trump Tariff V2” crash, Bitcoin reminded everyone that it can be volatile — it was just taking a nap. The sudden drop cleared a mountain of leveraged positions, resetting the market and setting the stage for an intriguing Q4.
No one has a short-term crystal ball. Like everyone else, we can’t say what next week will bring. But zooming out tells a clearer story: despite the noise, Bitcoin remains firmly aligned with its long-term power law trend — and the next chapter could be explosive.
The Trend’s Intact — Don’t Let the Noise Spook You
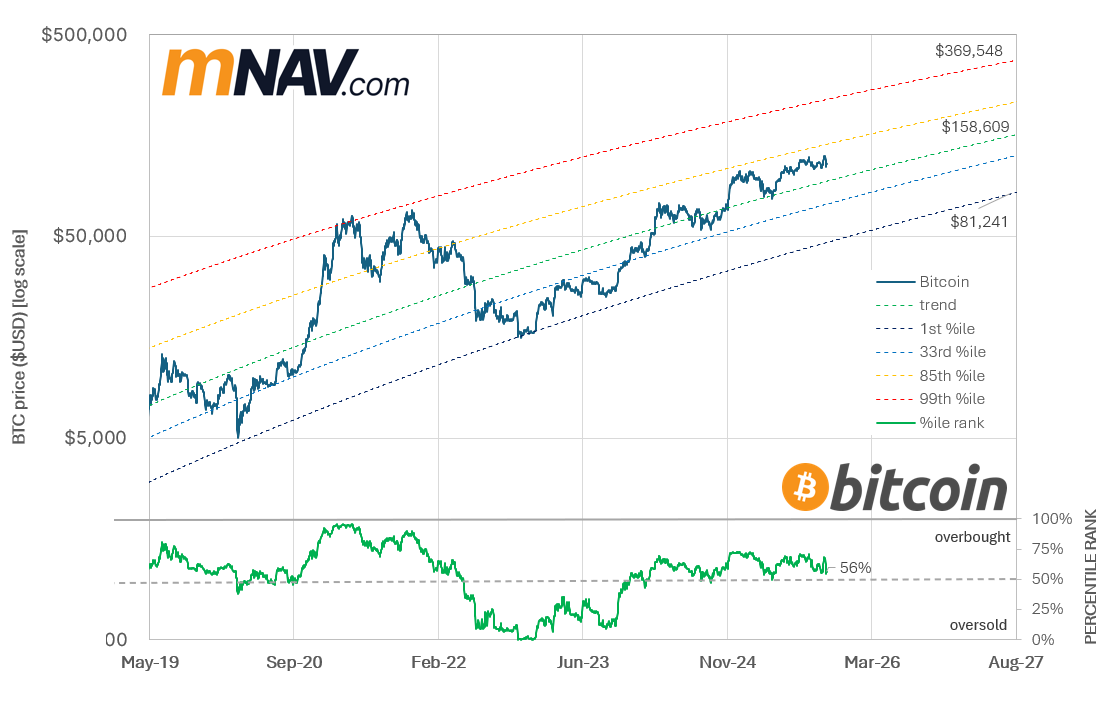
Despite the craziness of the past few days, Bitcoin is still rising along, in line with its long-term trend, just above the power law at the 54th percentile.
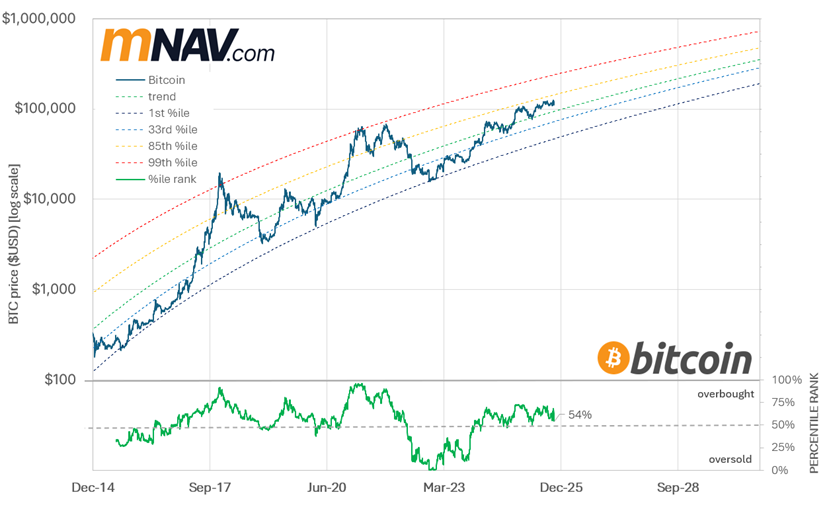
With nearly six thousand days of data over 17 years, the power law trend is only becoming more robust.
Beyond M2: A Better Compass for BTC’s True Value
Lots of people focus on M2 as a predictor of where BTC will go in the future.
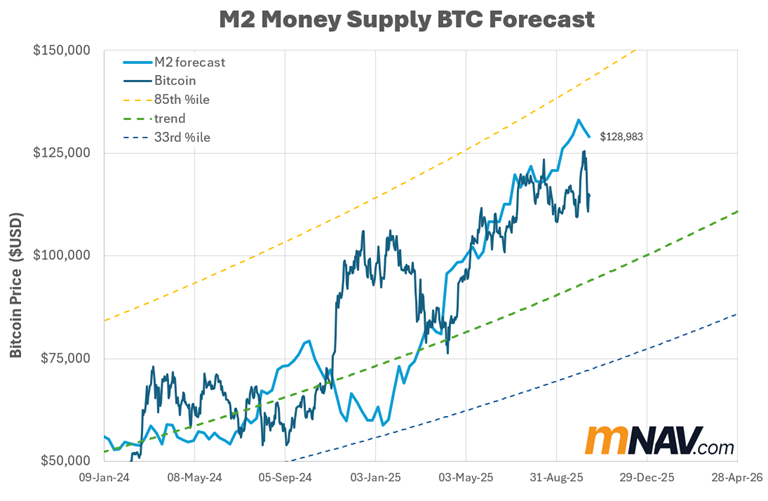
As shown in the chart below from BGometrics, M2 rose this year, peaking in June, and has flattened off since then. Many are expecting M2 to expand as the US Fed continues to lower rates through the rest of 2025.
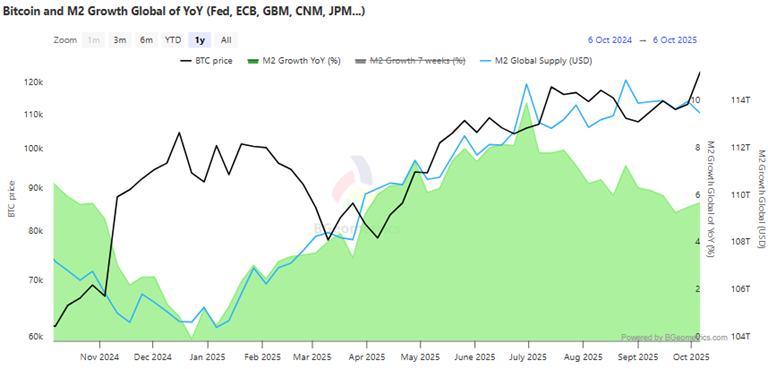
But rather than M2 alone, which can give some crazy aggressive forecasts, especially when assumed to be a leading indicator, we find we get a better understanding of where BTC should be by looking at gold, hash rate, and the S&P500. All of these have been on a solid uptrend recently, while BTC has lagged since August.
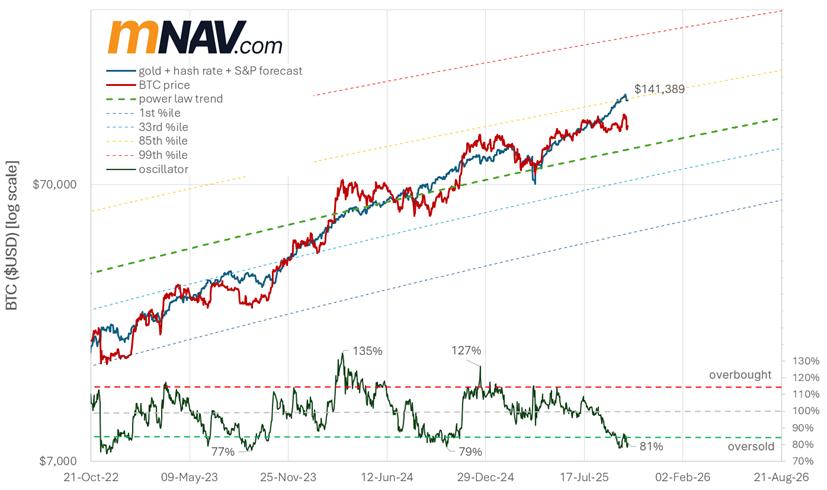
The oscillator between BTC and the composite regression is sitting at historic lows. The fair value based on this oscillator is $141k, and it would need to get to $163k to hit the overbought range.
In plain terms, BTC is cheaper than it should be compared to these other market components.
Wicked Wick. Clean Slate.
Over the long term, Bitcoin follows the power law trend, up and to the right. In the short term, many players, including market makers, play a role.
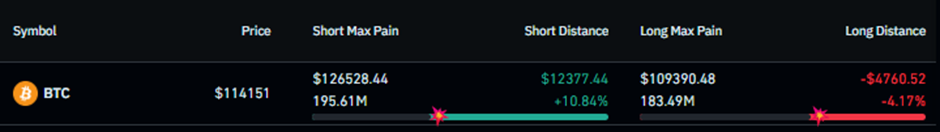
Last week, market makers had a problem with a large amount of leveraged longs sitting with a liquidation price of $108k. If they let Uptober rip with these in place, they’d have a lot of winnings to pay out at much higher levels. But with a wick down to $102k, these are now cleared (as shown in the liquidation map from coinglass).
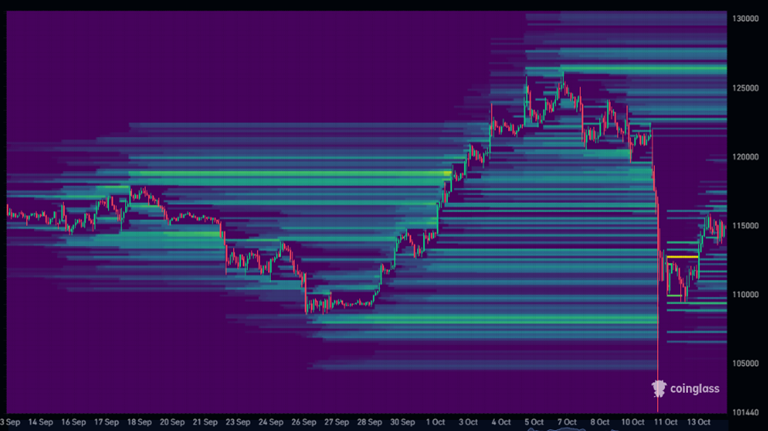
While it was brutal for anyone holding leveraged BTC on Friday afternoon, the good news for everyone else is that these are now cleared, with the bulk of the liquidation leverage sitting above the all-time high.
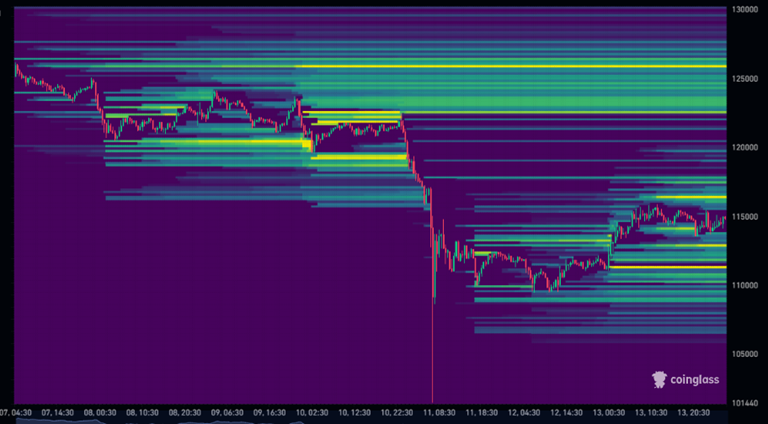
In the short to medium term, Bitcoin tends to bounce around between the liquidation max pain levels. Right now, the 1-month liquid max pain is sitting at $126k and $109k. While market makers could allow BTC to drop back to $109k to wipe out the new long leverage, they also have a strong incentive to allow BTC to rip back up to new all-time highs to clear this short leverage.
Yes, it’s brutal and unethical, and should probably be illegal, but that’s how things still seem to roll, which is why so many seasoned bitcoiners advise to just sit in spot and chill.
Cycles Within Cycles: The Evolution of BTC’s Rhythm
We’ve spent a bunch of time trying to understand the four-year cycles in Bitcoin. It looked like the supply crunch that happens with the halving might drive the four-yearly cycle. Or maybe it was the US presidential cycle (which happened to coincide with the halving).
But now many are concluding that the spikes in BTC prices, which occur every four years or so, actually align with the business cycle and liquidity, driven mainly by government refinancing cycles, which now appear to be extended to more of a five-year cycle (check out this video with Raoul Pal and Julien Bittel for more details).
However, for what it’s worth, the chart below shows what the annual cycles could look like if they repeat, with a peak of around $211k.
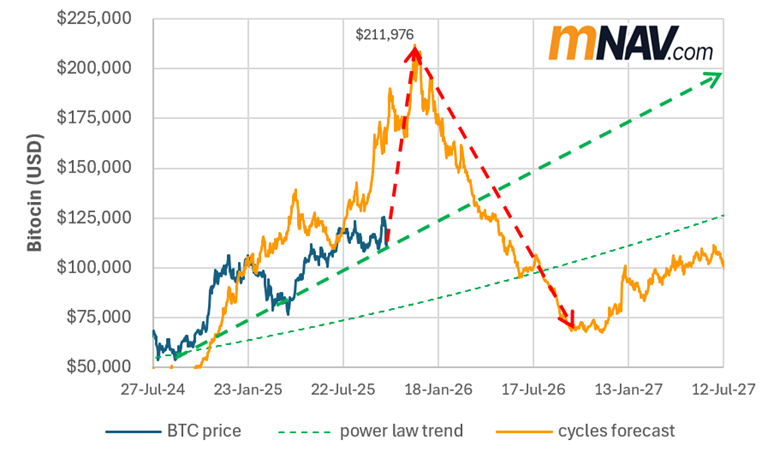
Unfortunately, for those waiting for BTC to go to the moon in early December, it looks like BTC will continue to cruise up along the power law trend, at least until the liquidity slows down. On the flipside, the good news is that we are less likely to see BTC plummet from a highly leveraged euphoric peak.
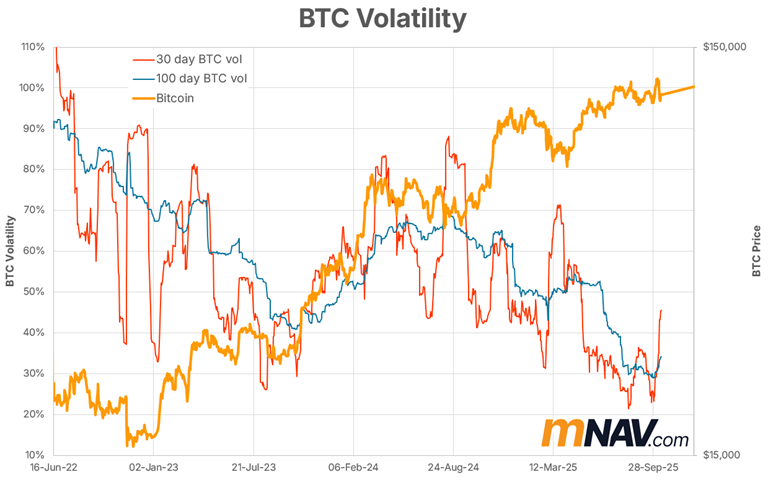
Boring Never Lasts: The Spring Is Tight
As shown in the chart below, volatility has been declining to record lows lately. As the bitcoin market cap becomes bigger and IBIT options have come online, volatility has compressed. But these boring, low-volatility periods can also act like a spring coiling, ready for BTC’s next explosive move.
Annual and Monthly Cycles Align for BTC’s Next Move
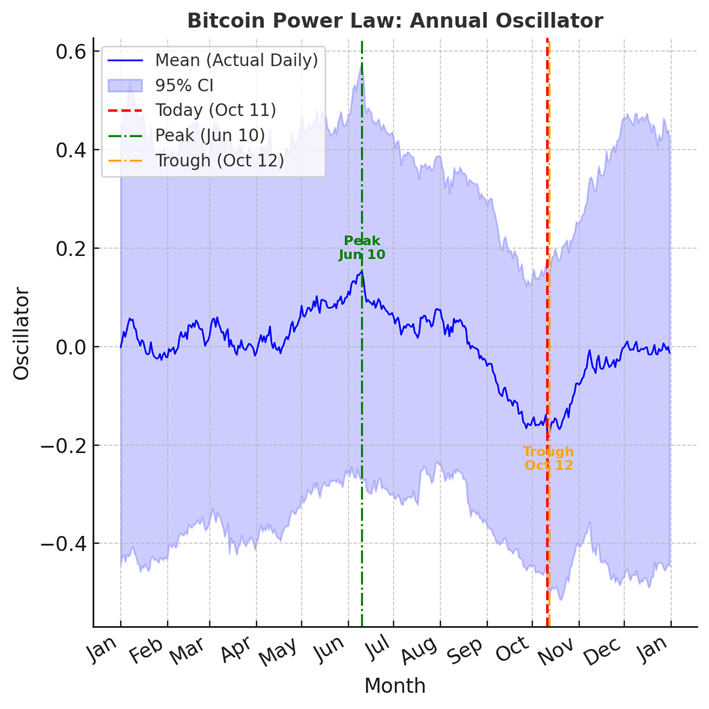
Lots of people have been waiting for Uptober, so we thought we’d dive back in and have a look at the annual cycles around the power law.
The chart below shows the log-log regression for the Bitcoin price. The four-yearly cycles stand out on this chart, but we can also look at the annual cycles, which are likely more reliable since active traders sell in May and then go on holiday until October.
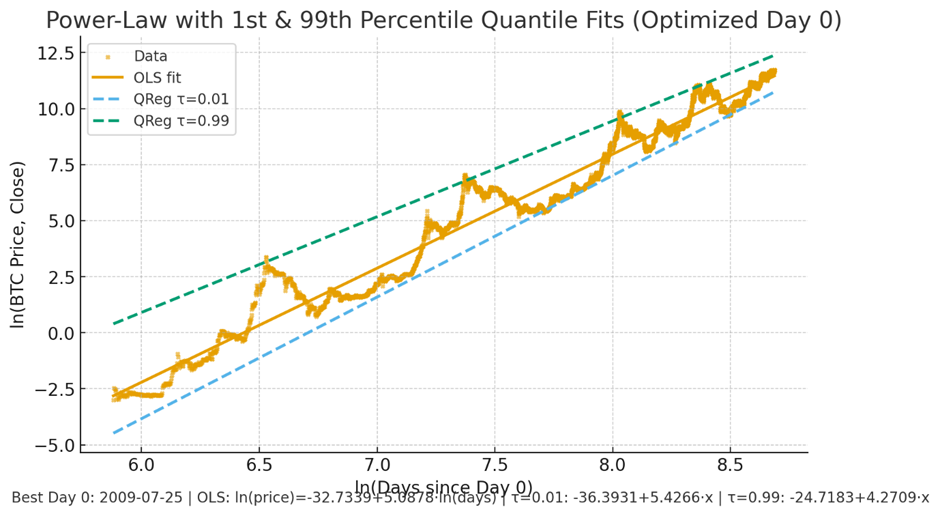
To create the chart below, we’ve created an oscillator that’s -1 when the BTC price is in the lower quantile and zero at the trend line in the chart above. While the 95th percentile confidence bands are wide, there is a distinct annual cycle, with a peak on 10 June and a low on 12 October each year (on average).
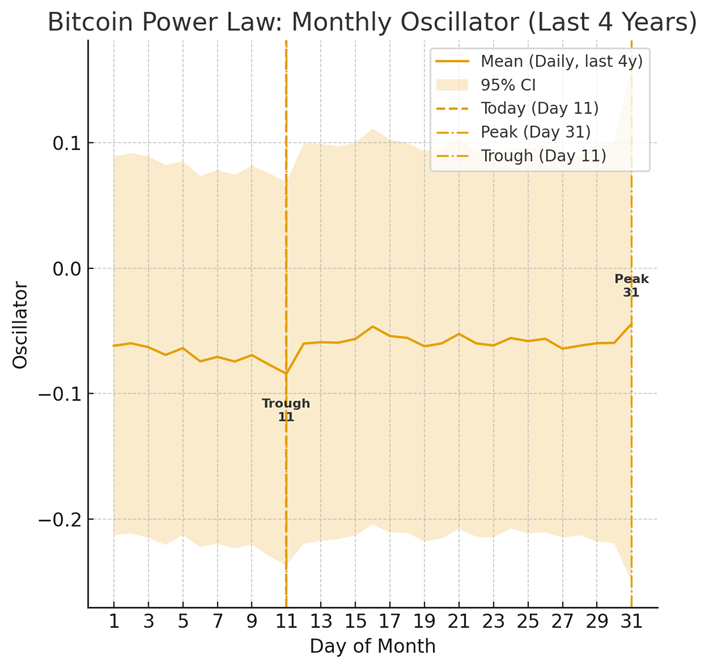
If we want to drill one level deeper, we can look at the monthly cycles, which tend to be at their lowest on the 11th day of the month and rise to a maximum by the end of the month. This monthly cycle is likely due to institutional fund rebalancing.
The Shakeout’s Over — The Setup’s Perfect.
While there are no guarantees and there is no way to predict bitcoin perfectly, several factors are lining up that give us hope for a positive end to the year:
· A massive amount of long leverage has been cleared, with a lot of juicy short liquidity for market makers now sitting above the all-time high,
· The market is not excessively overbought; instead, it’s sitting just above the power law trend line,
· Bitcoin is currently lagging relative to gold, hash rate and the S&P, and
· The annual and monthly cycle lows are now behind us.
After months of shakeouts and sideways pain, Bitcoin looks clean, coiled, and ready. The leverage is cleared, cycles are aligning, and the long-term trend is up and to the right.