From Hopium to Fundamentals: The Smart Way to Value BTC Treasury Companies


After a ballistic debut, Bitcoin Treasury Companies (BTC-TCs) have hit their first real test.
Once the hottest trade on the market, the sector has crashed hard — with many companies now trading at mNAVs below 1.
Investors piled in early to ride Bitcoin’s momentum, chasing leveraged exposure without the risk of margin calls.
But when Bitcoin’s run slowed after the post-tariff surge, traders bailed on the BTC-TCs and short sellers circled. The flywheel that powered early gains — number go up technology — stopped spinning.
Now, with sentiment low and valuations compressed, the question is: which BTC-TCs are real businesses that will emerge when BTC makes its next move up.
At mNAV.com, we believe the answer lies in data — not vibes or endless hopium.
This article breaks down a quantitative framework to value Bitcoin Treasury Companies using three key drivers:
1. BTC price — the macro power law trend.
2. BTC/share — the stacking trajectory.
3. mNAV — the market’s confidence multiple.
TL;DR
Bitcoin Treasury Companies (BTC-TCs) are like leveraged versions of Bitcoin, but their value depends not just on BTC’s price, but on how fast they grow their Bitcoin per share (BTC/share).
Accretive BTC-TCs that consistently stack sats earn a premium (higher mNAV). As a BTC-TC grows its stack, its yield naturally slows, and its mNAV drifts down.
A BTC-TC needs to continually earn its mNAV by growing BTC/share faster than mNAV falls. Those that stop buying rapidly fall back to parity or worse.
While it’s impossible to know the future, we can gain a deeper understanding of which companies will be future winners through a deeper understanding of the trajectory of:
1. BTC price – the macro trend, modeled by Bitcoin’s power law.
2. BTC/share growth – the company’s stacking trajectory.
3. mNAV – the market’s confidence multiple.
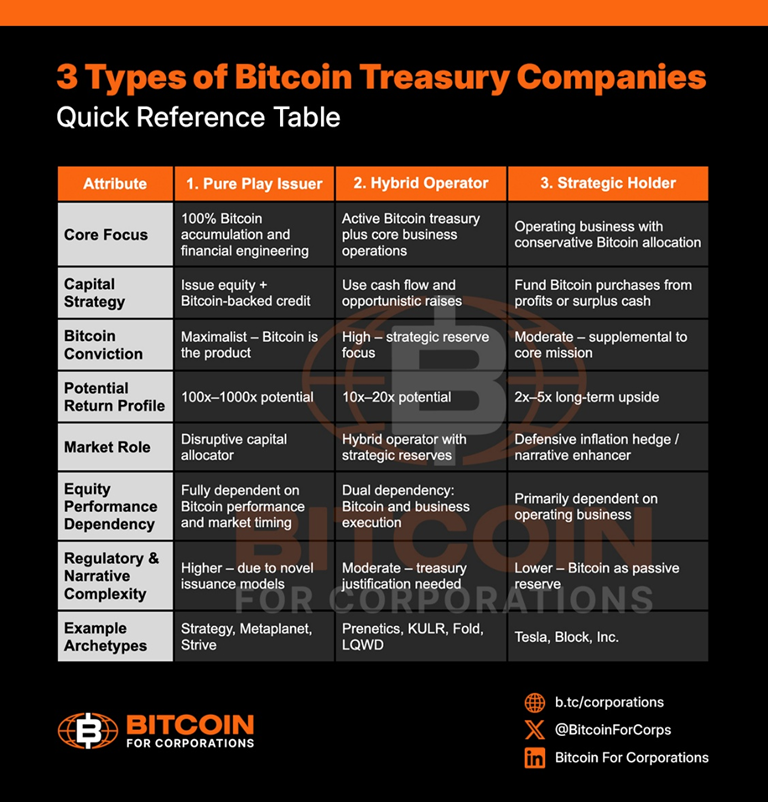
Accretive vs. Passive: The Real Divide in Bitcoin Treasuries
An accretive BTC-TC doesn’t just hold Bitcoin — it accumulates it. These companies deliberately grow their BTC/share through capital raises, ATMs, preferred share issuances, or debt-driven buys.
Because they’re expanding their stack faster than they dilute, investors assign them a higher mNAV — a premium that reflects belief in future BTC/share growth.
What Doesn’t Count: ETFs, Hodlers, and Pretenders
By contrast, passive holders aren’t growing their BTC/share. They may have exposure, but they don’t compound it. Their valuation stays anchored to the underlying BTC price, not their stacking rate.
ETFs like BlackRock’s IBIT don’t grow BTC/share. They mirror Bitcoin’s price and charge a fee, so by design, they’ll always trade near mNAV = 1 minus expenses.
Strategic hodlers such as Tesla, GameStop or other corporate adopters who park cash in BTC will still be valued on traditional metrics like P/E — not stacking velocity.
Companies that start with massive BTC buys may look impressive on day one, but face a denominator problem: their BTC Yield is stifled because growth on a large base is slow. In contrast, small accretive BTC-TCs that start lean and keep stacking steadily can grow BTC/share exponentially — and earn the multiple expansion that comes with it.
Other Approaches to Valuing BTC TCs
In a 2025 paper, Yves Choueifaty (TOBAM) modeled BTC-TC returns as a function of Bitcoin Yield + Bitcoin Growth + mNAV. He showed that BTC-TCs amplify Bitcoin’s beta — outperforming when BTC rises, underperforming when it chops or drops.
Meanwhile, Pierre Rochard recently offered a suite of qualitative heuristics for BTC-TC analysis.
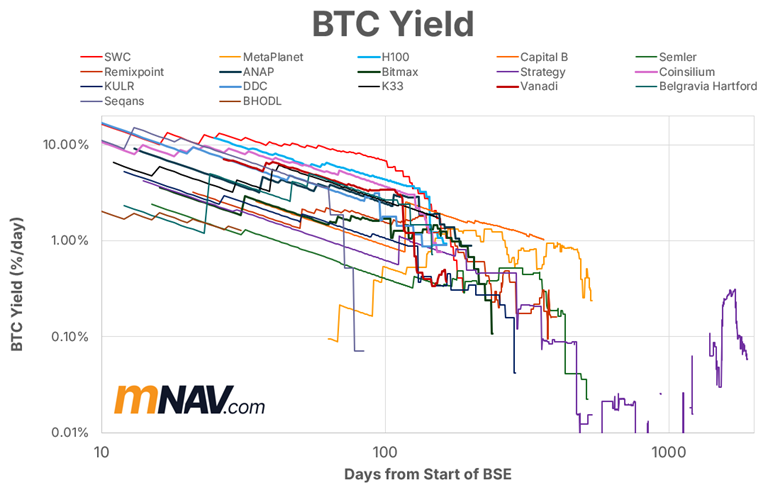
BTC-TCs are volatile and move fast—trajectory over time matters. At mNAV.com, we’ve extended these ideas by using power-law and Gompertz regressions to project future stacking trajectories and forecast expected returns.
The Simple Valuation Formula That Explains It All
Share Price = BTC Price × BTC/Share × mNAV
That’s it. Everything else — dilution, yield, sentiment — flows into one of these variables.
· BTC price follows a long-term power-law trend (currently ~37% CAGR).
· BTC/share depends on how fast the company grows its stack per share. mNAV expands when BTC Yield accelerates and compresses when it slows.
For a BTC-TC’s price to rise sustainably, BTC/share growth must outpace the natural decline in mNAV. When BTC Yield slows, mNAV falls.
The Base Layer: Bitcoin’s Power-Law Growth
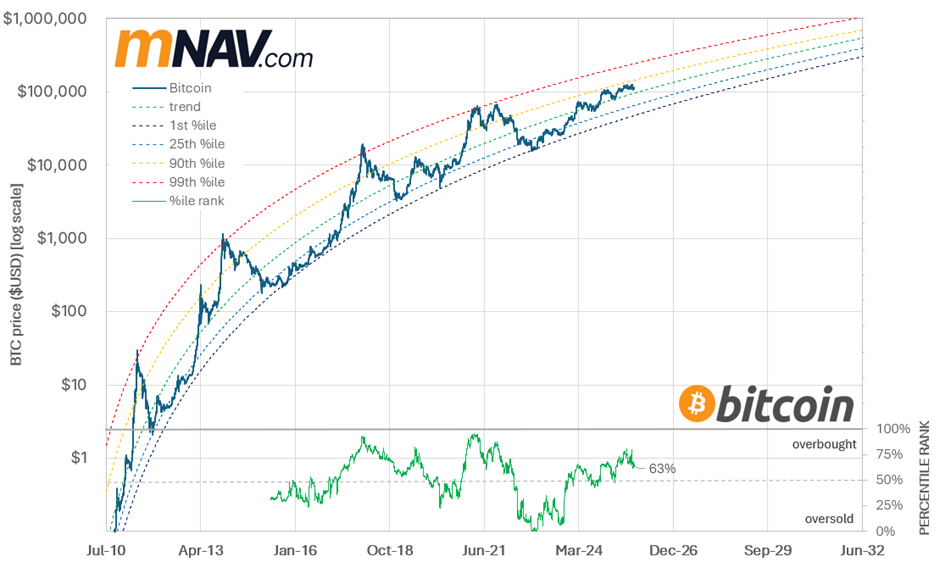
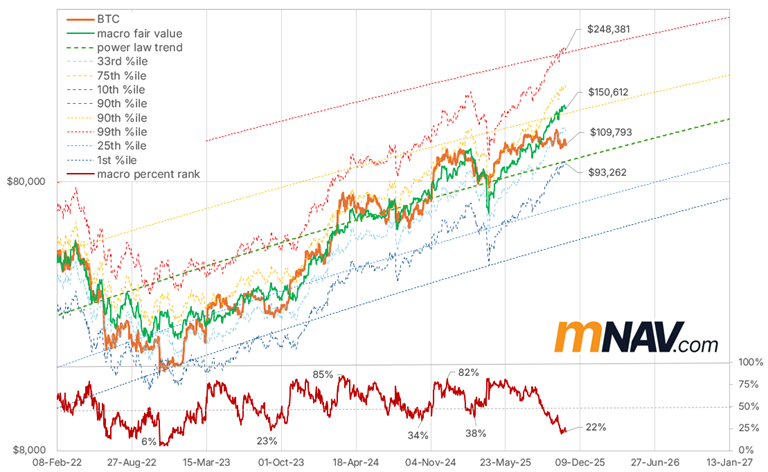
Bitcoin remains the foundation. Its long-term trend — up and to the right — follows a consistent power-law (log-log) relationship.
BTC-TCs are leveraged reflections of this curve. When Bitcoin rips, mNAVs expand as enthusiasm surges. When it stalls, multiples compress.
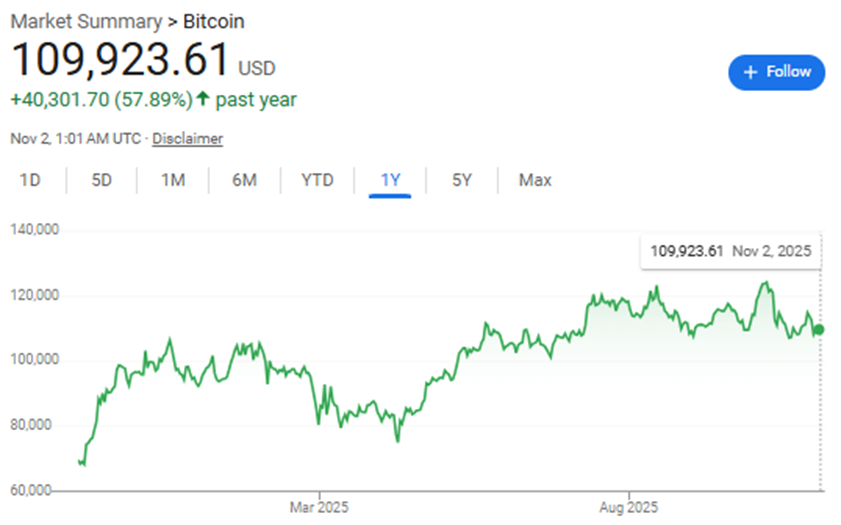
The price of Bitcoin is inherently volatile, but over the long term, it tends to follow a power law trend, up and to the right. While the bitcoin price has been more volatile lately and is influenced by a range of macroeconomic factors, the bitcoin power law is currently running at a CAGR of 37% p.a.
Many have been quick to declare the BTC-TC model dead for good, but it all makes sense when you zoom out. We saw many BTC-TCs explode higher between April and June as BTC recovered from $74k to $110k after post-tariff fears. But once BTC started to chop, investors rotated away from BTC-TC in search of the next fastest horse.
Stacking Efficiency: The Ultimate Measure of BTC-TC Strength
BTC/share = Total BTC held ÷ Total shares outstanding
Accretive BTC-TCs grow this ratio despite issuing new shares — a process called accretive dilution.
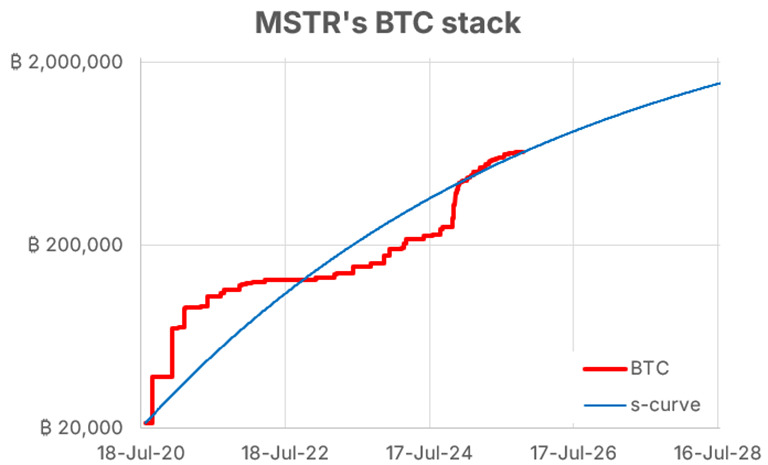
Example: Strategy has steadily increased BTC/share since 2020.
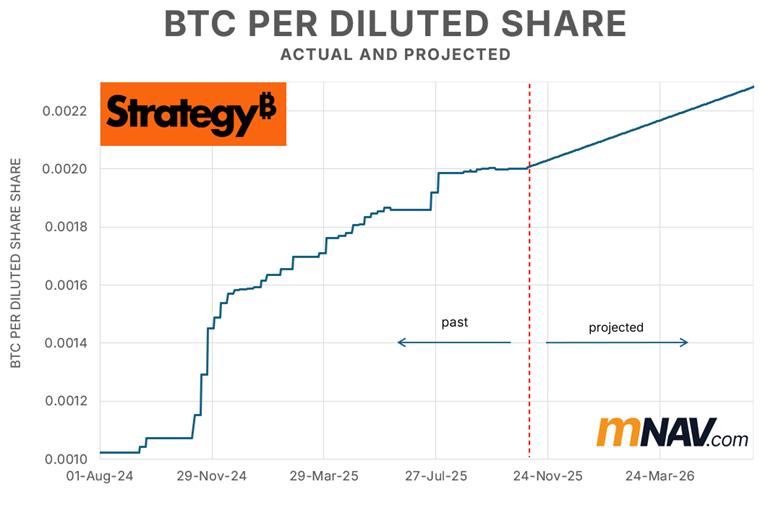
Convertible bonds and ATMs fueled aggressive stacking in late 2024, pushing its mNAV near 4. But as their BTC Yield has slowed (due to a large BTC stack and the transition from ATM to preferreds) and BTC has chopped, mNAV has fallen.

BTC Growth From Lumpy to Legendary: Why Consistency Wins in Stacking
Similar to the power law for BTC, we can model a company’s BTC accumulation curve using a Gompertz regression, which accounts for the fact that stacking must slow down before reaching 21m BTC.
Even Strategy, which has been the test case for the BTC-TC model, shows steady long-term growth, despite some short-term lumpiness.
Meanwhile, MetaPlanet has maintained a BTC Yield of ~0.9% per day for 15 months — an extraordinary run. Consistent stacking isn’t flashy — but it’s what keeps the regression pointing up and to the right.

Unfortunately, the story isn’t as bright and rosy for many other BTC-TC right now. Many of them have seen their BTC growth curves flatten as it becomes harder to find eager investors.
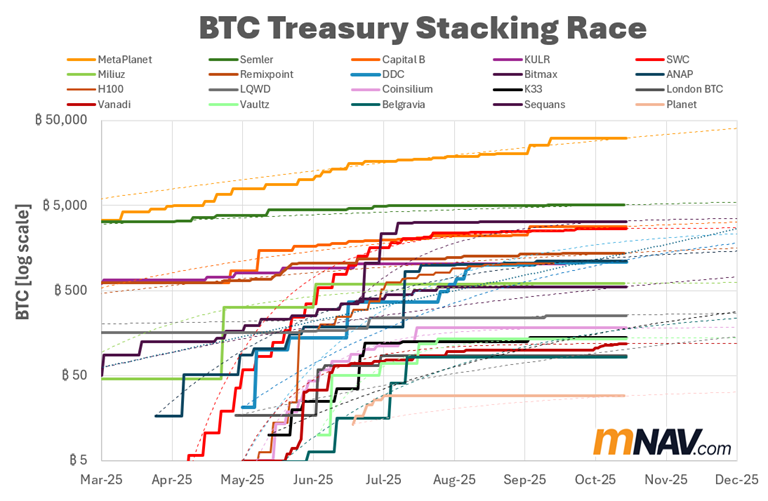
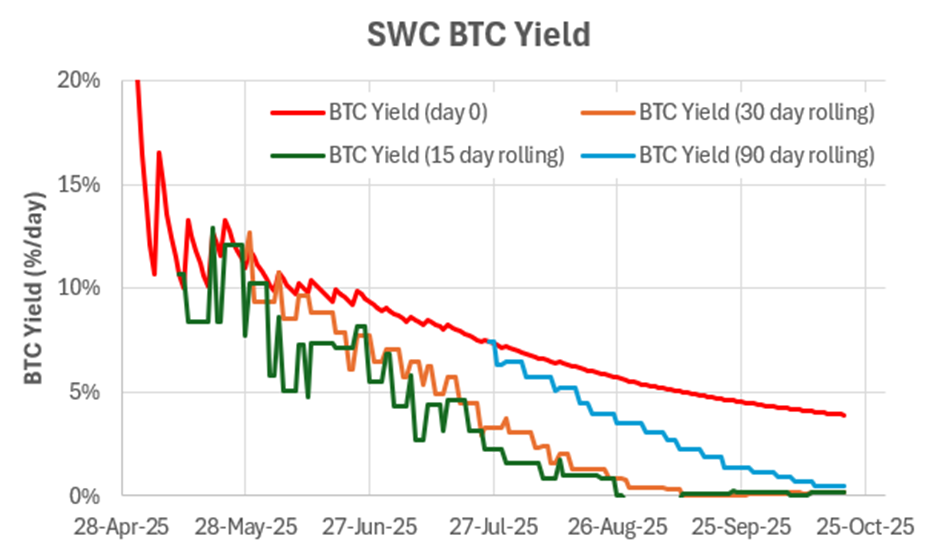
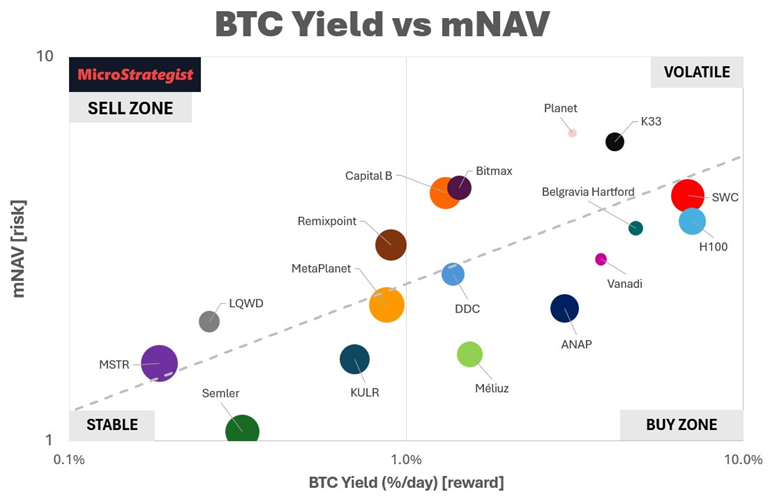
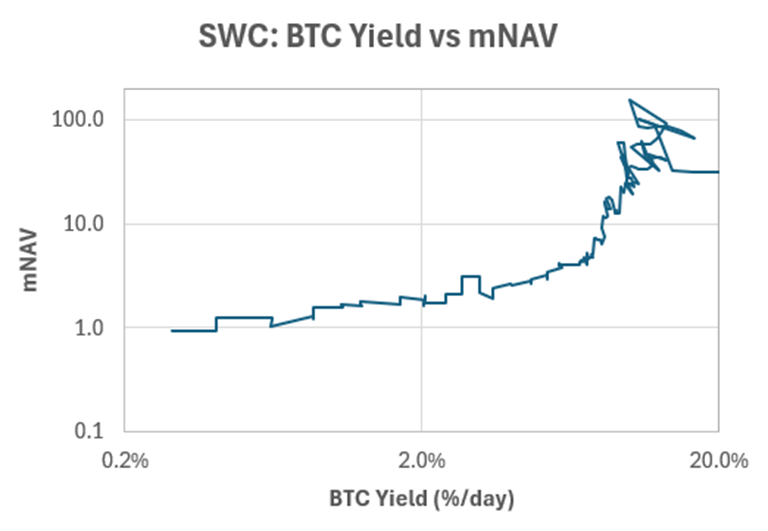
Many companies, like Smarter Web, went all out in the early days with super-high BTC yields but have struggled to maintain that pace.

It’s normal for BTC Yield to slow, but a sudden change in stacking pace can be diabolical, leading to a rapid collapse in mNAV. The chart below shows SWC’s BTC Yield with different lookback periods. As detailed in this article, savvy investors seem to focus on the shorter yield lookback window, meaning they pivot aggressively on short-term trends.
BTC Yield — The Lifeblood of Every Treasury Company
BTC Yield (i.e., change in BTC/share) is the #1 KPI for every astute Bitcoin treasury CEO.
Because BTC Yield is a function of the current stack size, it tends to fall as a company grows. A smaller BTC-TC may have a sky-high BTC Yield and hence mNAV in the early days, but if it can’t maintain its pace of BTC buying, its BTC Yield inevitably falls.
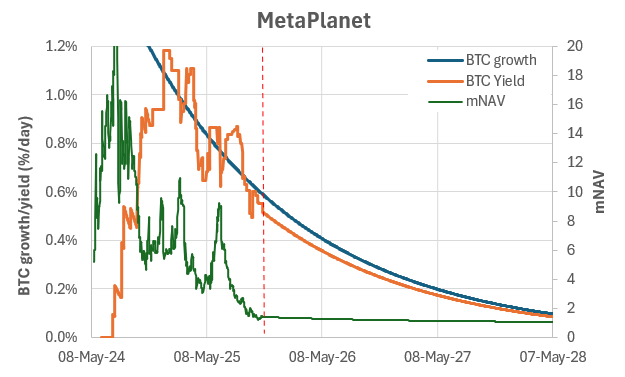
We can use the slowing Bitcoin growth rate to forecast the future decline in BTC Yield from current levels (as shown below for MetaPlanet). The inevitable slowing of the BTC growth rate helps us understand where BTC Yield might be headed.
mNAV: Measuring Belief in Future Stacking
Many see the multiple of net asset value (mNAV) as simply a sentiment measure, but it’s closely correlated with BTC Yield. The relationship isn’t a 1:1, but companies with higher BTC Yield tend to have higher mNAV.
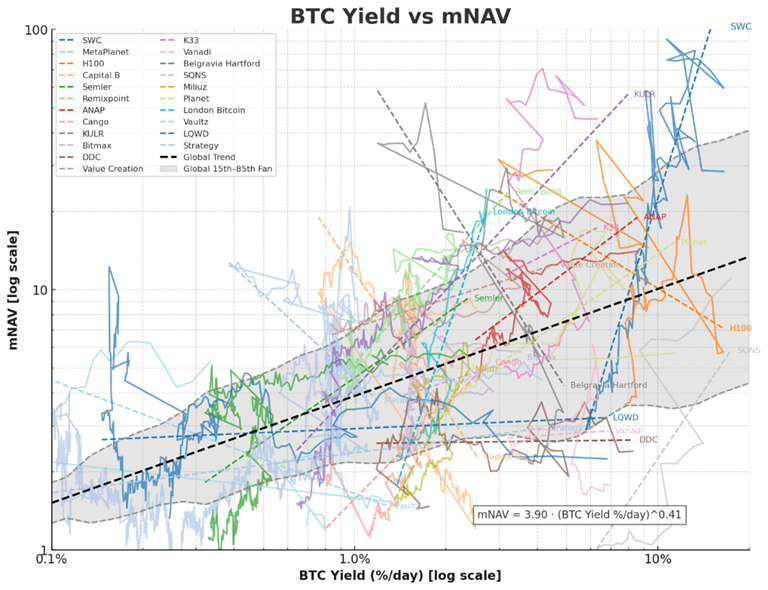
As BTC Yield inevitably slows as the company's BTC stack grows, mNAV follows a power-law decline.

Investors are willing to pay a higher mNAV for quickly growing smaller companies, but they’re also much more volatile!
The chart below shows how MetaPlanet’s mNAV has oscillated around the power-law trendline. Their mNAV might be down right now, but because they have grown slowly and consistently, we can reasonably expect their mNAV to jump back above the long-term trend line, so long as they continue to buy BTC at a similar rate and maintain a similar BTC Yield.

Meanwhile, we have no precedent for smaller companies that started with super-high BTC Yields and mNAV. For example, SWC’s mNAV has fallen from 100 to less than one over 180 days.
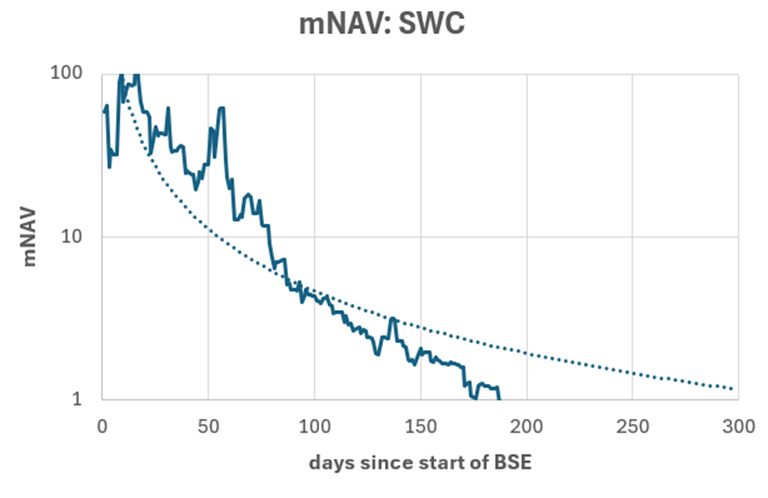
SWC’s mNAV might bounce back above the trend line, but only if they can restart their BTC buying engine once BTC starts to rise again.
Three Drivers, One Model: The Complete BTC-TC Valuation Framework
To bring all this together, we now have a way to forecast the trajectory of the three components of TC price:
1. BTC price – using the Bitcoin power law, up and to the right,
2. BTC Yield – using the projected growth in BTC (as BTC stack grows, BTC growth and BTC Yield decrease), and
3. mNAV – proportional to decreasing BTC Yield rate.
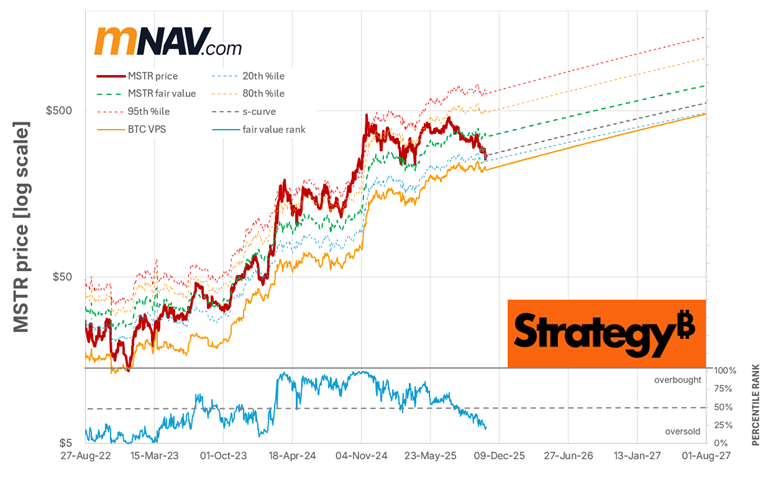
The chart below shows the projected growth in Strategy’s price and bitcoin value per share. If Bitcoin continues to follow a power-law growth rate and Strategy continues its stacking trajectory, we could expect Strategy’s share price growth to be twice that of Bitcoin’s.
Meanwhile, if MetaPlanet's long-term trend trajectory continues, it might see a CAGR of 100% p.a., which is lower than we’ve seen in the past but well above the rest of the market.

From these projections, we can calculate the CAGR from now to a future date, as shown in the chart below. Despite recent poor performance, our models suggest that many of these BTC-TCs could produce excessive returns, providing:
· BTC continues to grow in line with the power law, and
· These companies can continue their current BTC Yield.
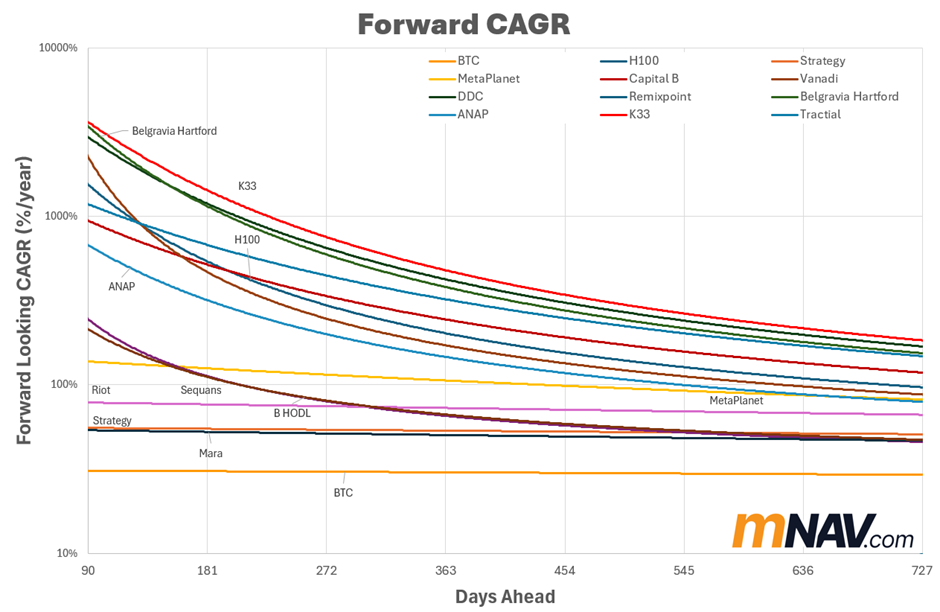
These are some BIG ifs in the current environment. BTC seems to be stagnating as long-term holders take profits and many BTC-TCs appear paralysed, unable to buy BTC until BTC rips and they can raise funds again.
Meanwhile, both Strategy and MetaPlanet are currently transitioning to preferred shares to offer credit to a yield-starved bond and money market. Over the long term, there is huge potential here, but it’s still early days.

It’s also worth noting that companies with a longer history of consistent growth (e.g., Strategy, Metaplanet, and Marathon) have lower, but much more stable, growth projections over the next couple of years. Meanwhile, smaller companies might make a rapid comeback, but that might slow as their stack grows.
Meanwhile, many other companies that have seen their BTC stacking grind to a halt didn’t make this comparison chart because their forecast return is negative.
Companies with an mNAV greater than 1 but that have stopped stacking are likely to continue falling until their mNAV settles somewhere below 1. There’s a good chance that companies that fail to grow will be gobbled up by larger, successful BTC-TCs looking for cheap bitcoin.
When Will the Next Wave Hit
The reality is, it’s impossible to know what the future holds. But the method detailed above enables us to compare companies based on their trajectory over time.
Bitcoin Growth
The most significant factor, of course, is the BTC price. Since June, Bitcoin has been chopping sideways, so the price of BTC-TCs has been collapsing. But if Bitcoin resumes its consistent power law growth rate, we could quickly be back on the growth trajectories shown above.
Chasing the Fastest Horse
Back in June, fast money rotated out BTC-TCs and into Ethereum treasury companies, as well as gold miners and AI. If Bitcoin picks up again, this fast money may rotate back to Bitcoin and the treasury companies. But it’s impossible to know when that might occur.
Investor Support
Earlier in the year, it was easy for BTC-TCs to find IPO investors, eager to make a quick buck and then potentially sell into the retail hype (e.g., PIPE investments). Going forward, though, it will likely be more challenging for these existing BTC-TCs to find investors willing to continue funding their growth. Great lending terms might be harder to come by for BTC-TCs — investors are spoiled for choice and currently have the upper hand.
But all that said, I think it’s highly likely that BTC-TCs who have demonstrated a long-term commitment to consistent stacking through the hard times will find supporting investors to jump on board when Bitcoin looks poised to make its next leg up.
Bitcoin is Lagging Macro
Right now, bitcoin is bumping along well above the power-law trend but well behind the macro fair value (based on the PMI, S&P, M2, gold, IWM, and hash rate). Perhaps once the OG whales and 4-year cycle believers finish taking profits, Bitcoin will catch up to its fair value, currently at $150k, and BTC-TCs who have survived their bear market will rally even harder.
Only the Relentless Stackers Will Survive
Bitcoin Treasury Companies are still an emerging asset class — part equity, part Bitcoin ETF, and part leverage on conviction.
Their performance is inherently cyclical, swinging harder than the underlying asset. But the framework outlined here gives investors and analysts a way to cut through the hype and focus on what matters most: consistent, accretive BTC/share growth.
Companies that keep stacking through the slow grind — not just in bull runs — will be the ones that earn a durable mNAV premium and survive the inevitable rotations of “fast money.”
The history of corporate Bitcoin adoption is short, but patterns are already clear: those who build steadily and transparently are the ones investors trust when the next wave hits.
If Bitcoin resumes its power-law trajectory and catches up to its macro fair value, the few BTC-TCs still actively stacking during this consolidation will be positioned to capture the outsized returns that come when sentiment and fundamentals finally align.
Ready to See Which BTC-TCs Are Built to Last?
At mNAV.com, we help investors and corporate leaders cut through the noise with data-driven insights into Bitcoin and Bitcoin Treasury Companies.
Our interactive dashboards model each company’s BTC price exposure, stacking trajectory, and mNAV multiple, giving you a clear picture of who’s compounding value — and who’s just coasting.
For Bitcoin treasury executives, we also offer strategic planning and modeling support to help them :
· Forecast BTC/share growth under different funding and dilution scenarios
· Identify your company’s optimal stacking pace to ensure you stay in the game.
· Communicate your value to investors using our quantitative framework and dashboards.